The gold price has made a big comeback
While backs were turned, gold staged an impressive rally. John C Burford analyses the charts to find out where gold is heading next.
Get the latest financial news, insights and expert analysis from our award-winning MoneyWeek team, to help you understand what really matters when it comes to your finances.
You are now subscribed
Your newsletter sign-up was successful
Want to add more newsletters?

Twice daily
MoneyWeek
Get the latest financial news, insights and expert analysis from our award-winning MoneyWeek team, to help you understand what really matters when it comes to your finances.

Four times a week
Look After My Bills
Sign up to our free money-saving newsletter, filled with the latest news and expert advice to help you find the best tips and deals for managing your bills. Start saving today!
With the can having now been kicked down the long and winding road in Washington, I can turn my attention to gold a market where the recent sharp declines have resulted in an equally sharp reduction in commentary by the gold pundits.
When gold is in rally mode, the coverage is extensive and enthusiastic. This mirrors the conventional reaction to rising markets, where most people become more and more excitedly bullish as prices rise, reaching a climax at tops.
It is when it goes quiet that you should expect a turn up. Yesterday was a prime example!
MoneyWeek
Subscribe to MoneyWeek today and get your first six magazine issues absolutely FREE

Sign up to Money Morning
Don't miss the latest investment and personal finances news, market analysis, plus money-saving tips with our free twice-daily newsletter
Don't miss the latest investment and personal finances news, market analysis, plus money-saving tips with our free twice-daily newsletter
A roadmap for your analysis
In the short term, I was waiting for a five-wave pattern to be completed:
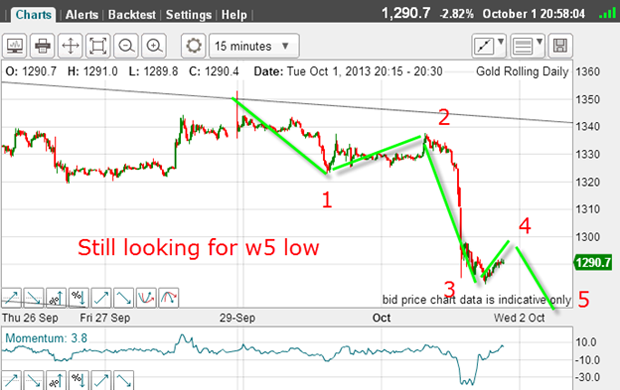
If a wave 5 would appear, below the low of wave 3, then I can expect a relief rally and hopefully an opportunity to search a short trade.
That is the great benefit of Elliott wave analysis - it gives you a clear roadmap.
And if the market fails to follow this map, then you know your analysis is wrong. It also gives you the signal to take evasive action, if necessary.
But as it happened, I did get my wave 5:
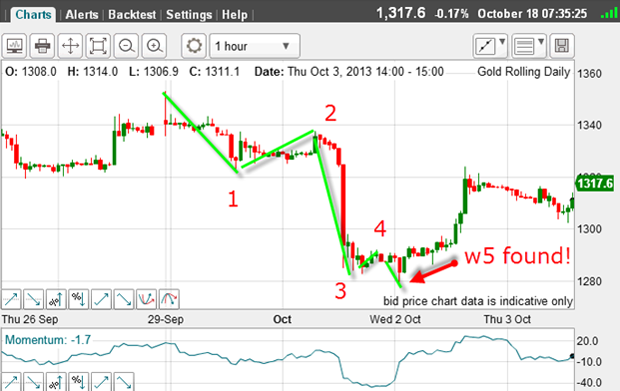
Any trader wishing to go long gold could use this knowledge to enter low-risk trades.
Instead of just jumping into the market with no roadmap, a trader could, for instance, wait for the fifth wave (and note the positive-momentum divergence to boot) and consider entering a long trade on a buy stop just above the wave 4 high.
Now, at this point, we should expect a rally and sure enough, a big rally ensued.
Multiple waves make for a more complicated analysis
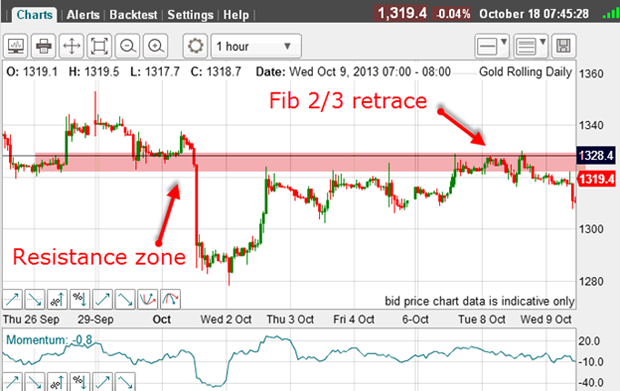
In fact, there are many waves and they do not easily lend themselves to a simple Elliott wave analysis.
And when the market carried to the heavy overhead resistance and the Fibonacci 2/3 retrace and on weakening momentum it was time to look to exit any long trades and look for a short position.
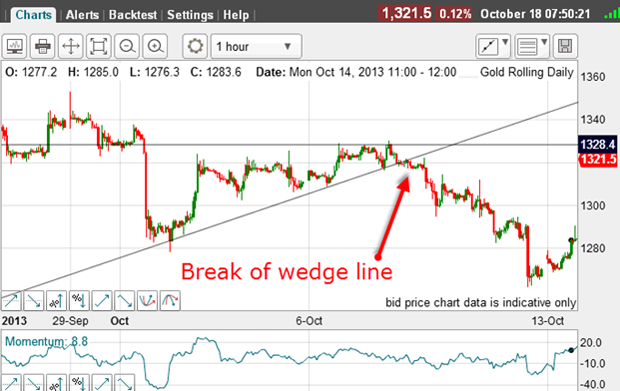
Of course, an aggressive trader would be looking to short near the Fibonacci line at the $1,328 level, whereas a more conservative trader would look to short on the break of the wedge line.
Either way, the result was excellent, as the market fell sharply and broke below the early October low in a blow-off plunge.
When to expect a rally
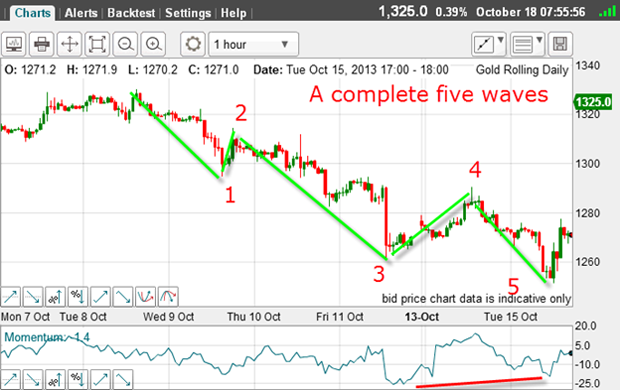
Wave 3 is long and strong, wave 4 has a clear A-B-C, and wave 5 sports a positive-momentum divergence.
When all of the boxes have been ticked, you can conclude the decline has run its course and expect a rally.
And what a rally!
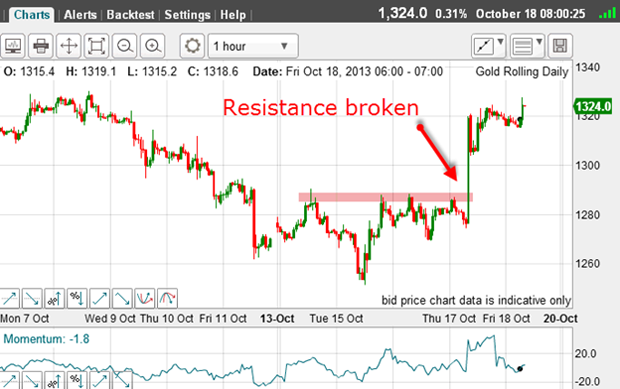
Yesterday, the market rallied almost $40 on the day and squeezed many shorts, who had built up large positions.
Sentiment was very bearish gold (as reflected in the paucity of coverage I mentioned above), and the market was ripe for a major correction.
Is this rally a prelude to another decline?
Here is the daily chart:
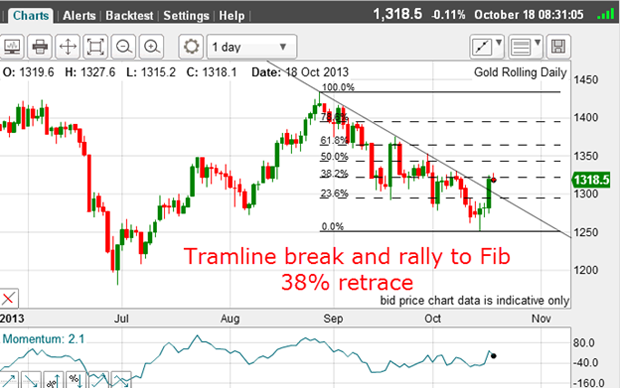
Yesterday's rally broke the solid tramline and is pausing at the Fibonacci 38% retrace level, which is expected.
After a tramline break, we normally see a pull-back to the tramline, and sometimes it kisses the line before moving back up in a 'scalded cat bounce', or crashing back through the line.
There is no way to forecast which scenario will play out, but the odds do favour a pull-back, at least to the line.
With this knowledge, you can plan your trades using a disciplined, methodical approach. Keep in mind that any alternative to this approach invariably gets a trader into trouble.
Get the latest financial news, insights and expert analysis from our award-winning MoneyWeek team, to help you understand what really matters when it comes to your finances.
John is is a British-born lapsed PhD physicist, who previously worked for Nasa on the Mars exploration team. He is a former commodity trading advisor with the US Commodities Futures Trading Commission, and worked in a boutique futures house in California in the 1980s.
He was a partner in one of the first futures newsletter advisory services, based in Washington DC, specialising in pork bellies and currencies. John is primarily a chart-reading trader, having cut his trading teeth in the days before PCs.
As well as his work in the financial world, he has launched, run and sold several 'real' businesses producing 'real' products.
-
 ISA fund and trust picks for every type of investor – which could work for you?
Whether you’re an ISA investor seeking reliable returns, looking to add a bit more risk to your portfolio or are new to investing, MoneyWeek asked the experts for funds and investment trusts you could consider in 2026
-
 The most popular fund sectors of 2025 as investor outflows continue
It was another difficult year for fund inflows but there are signs that investors are returning to the financial markets