Why the next few days are crucial for gold
In gold, the charts are showing that the market really wants to fall, says John C Burford. Here, he looks at what should prove to be a crucial time for gold.
Get the latest financial news, insights and expert analysis from our award-winning MoneyWeek team, to help you understand what really matters when it comes to your finances.
You are now subscribed
Your newsletter sign-up was successful
Want to add more newsletters?

Twice daily
MoneyWeek
Get the latest financial news, insights and expert analysis from our award-winning MoneyWeek team, to help you understand what really matters when it comes to your finances.

Four times a week
Look After My Bills
Sign up to our free money-saving newsletter, filled with the latest news and expert advice to help you find the best tips and deals for managing your bills. Start saving today!
While you were sleeping, overnight sessions in many markets were weak. I think this is telling. And if you've got a strategy in place, there could be some great trading opportunities ahead
We could well be on the verge of a waterfall decline in the Dow and the euro and in gold, which I will cover today.
In my 9 May article, I challenged the gold bulls to consider the question: "Why is gold holding up so well in the face of weak gold stocks?"
MoneyWeek
Subscribe to MoneyWeek today and get your first six magazine issues absolutely FREE

Sign up to Money Morning
Don't miss the latest investment and personal finances news, market analysis, plus money-saving tips with our free twice-daily newsletter
Don't miss the latest investment and personal finances news, market analysis, plus money-saving tips with our free twice-daily newsletter
Most of the comment on the recent weak performance of gold shares is phrased the other way around, of course.
What I want to do today is to ask you to think the unthinkable. You see, when someone convinces themself that something is a great investment because of the factors we all know about, then they often find it difficult to countenance the opposing view.
And when a trader becomes angry at the mere suggestion that gold today is not a great investment, they have entered a stage which I call the manic phase. It is not unlike religious zeal in its effects on the trader.
When you combine that with a losing position, the denial phase is sure to follow.
Trader tip: Trading is totally psychological. Traders do not do battle with the markets they do battle with themselves.
Gold is probably the most emotional market I know. Compare it with the much more sober US Treasury, or T-bond, market. Large professional interests dominate that market.
With gold in 2012, though, we have a huge number of retail investors/traders, most having strong opinions on why they favour gold. They make up the bulk of the long side. Most of the shorts in gold are professionals.
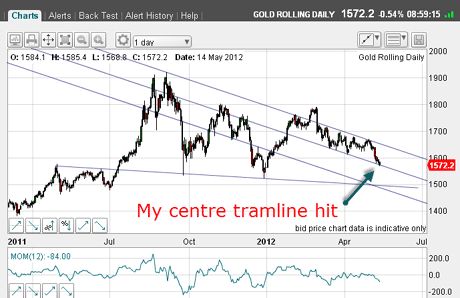
But you're here to learn how to trade using charts, so let's move on. Here is the updated daily chart of gold showing my lovely tramline trio:

(Click on the chart for a larger version)
Last time, I had my first target set at $1,575, and that was hit last week. As I write, the brief rally to the $1,590 level on Friday has sputtered out and new lows beckon.
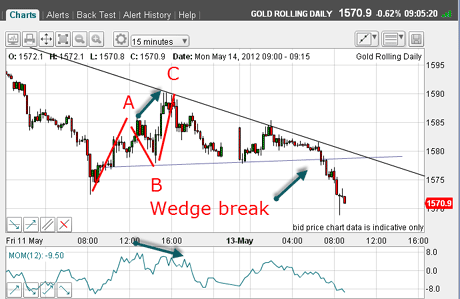
Here is the Friday rally on the 15-minute chart:

(Click on the chart for a larger version)
You can see how Friday's rally has a clear A-B-C form and there is a large negative momentum divergence. Also wave C topped on a Fibonacci retrace!
With all these factors lining up, a short trade at wave C was very much indicated. I would put that trade in the Premiership class!
My line in the sand for gold
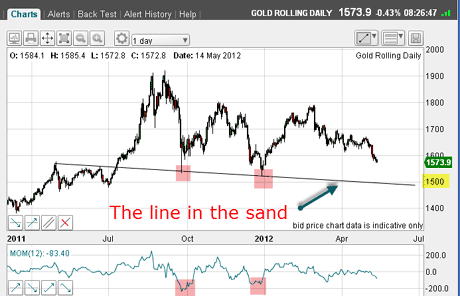
OK, the charts indicate that we have a market that really wants to fall. I have had my first major target at the $1,500 area for some time. Here is the updated daily chart:

(Click on the chart for a larger version)
The support line I call my 'line in the sand' is interesting. Note the spikes down to it in October and January. The momentum on both occasions became oversold.
This led to large rallies off both spikes. There is evidently solid support in this region. We may see a similar pattern if and when the market gets down towards $1,500, especially if that occurs within the next few days.
If so, the centre tramline on my first chart will be penetrated, and would be a bearish development.
If the market then falls to the $1,500 region, I will look at taking profits. But if the market crashes through this region, all bets are off.
Many are asking me if I will turn bullish at $1,500 and go long?
That is too far into the future for me to give an answer right now, but I promise I will have one for you as and when. You see, I let the charts make up my mind!
One important point before I leave, I note that bullish sentiment towards gold has been dropping sharply in recent days. This is normally a warning for me to watch my back! I do this anyway, of course. But with the market remaining heavily weighted to the long side, it is not a major concern for me just yet.
I would like to see long capitulation say a $40 or $50 down day before taking this sentiment data on board.
That's all for today. If you have any thoughts on gold, tramlines and the charts, do please leave a comment below.
If you're a new reader, or need a reminder about some of the methods I refer to in my trades, then do have a look at my introductory videos:
The essentials of tramline trading
An introduction to Elliott wave theory
Advanced trading with Elliott waves
Don't miss my next trading insight. To receive all my spread betting blog posts by email, as soon as I've written them, just sign up here .
Get the latest financial news, insights and expert analysis from our award-winning MoneyWeek team, to help you understand what really matters when it comes to your finances.
John is is a British-born lapsed PhD physicist, who previously worked for Nasa on the Mars exploration team. He is a former commodity trading advisor with the US Commodities Futures Trading Commission, and worked in a boutique futures house in California in the 1980s.
He was a partner in one of the first futures newsletter advisory services, based in Washington DC, specialising in pork bellies and currencies. John is primarily a chart-reading trader, having cut his trading teeth in the days before PCs.
As well as his work in the financial world, he has launched, run and sold several 'real' businesses producing 'real' products.
-
 ISA fund and trust picks for every type of investor – which could work for you?
Whether you’re an ISA investor seeking reliable returns, looking to add a bit more risk to your portfolio or are new to investing, MoneyWeek asked the experts for funds and investment trusts you could consider in 2026
-
 The most popular fund sectors of 2025 as investor outflows continue
It was another difficult year for fund inflows but there are signs that investors are returning to the financial markets