Over the weekend, initial optimism about having found a magic bullet for the euro debt crisis waned fast.
This has been a repeating pattern, which has given traders many rallies on which to short the euro against the US dollar.
Lets look at the euro/US dollar chart.
Try 6 free issues of MoneyWeek today
Get unparalleled financial insight, analysis and expert opinion you can profit from.

Sign up to Money Morning
Don't miss the latest investment and personal finances news, market analysis, plus money-saving tips with our free twice-daily newsletter
Don't miss the latest investment and personal finances news, market analysis, plus money-saving tips with our free twice-daily newsletter
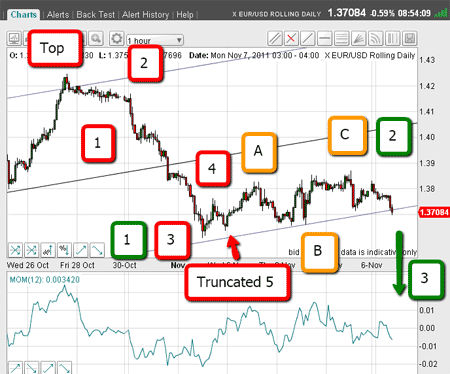
On Friday, the market was bouncing off my lower tramline following a sharp break. This break and the relief rally are forming a classic Elliott wave pattern and is confirming my bear market analysis (so far).
But, I can now draw an extra set of tramlines to trade off.
First, let's look at the Elliott wave pattern (for more on Elliott waves, see my video here: An introduction to Elliott wave theory).
(Click on the chart for a larger version)
The decline off the 27 October high occurred in five clear waves. Wave 3 is a classic long and strong move. The fifth wave is a truncated wave in that it did not make a new low (lower than wave 3). Truncations do occur, especially on short-term moves and where the third wave is especially strong, as here.
Now, the relief rally that occurred off the back of wave 5 is in a clear A-B-C format. Wave C is higher than wave A and has retraced only a Fibonacci 38% of the entire move down (you can check this for yourself).
If my labelling is correct, these small-scale waves are part of a larger structure, where my wave 3 (red) can be counted as a larger wave 1 (green) down, wave C (yellow) is a new wave 2 (green), and the next move will likely be a green wave 3 down.
If I am correct, this wave will be very large I am looking for a long and strong move.
Confirming the patterns
But to confirm my analysis, the market must break the support provided by my lower tramline. As always, this could be strong support and lead to a rally. I must be always alert to this possibility.
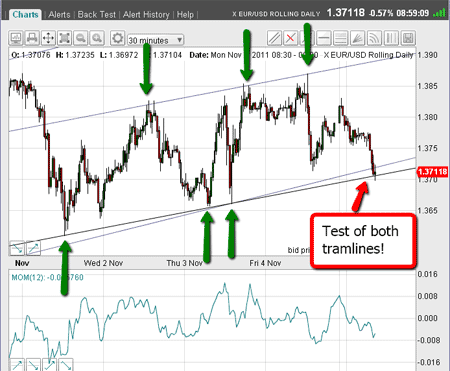
So now let's zoom in on this relief rally on the 30-minute chart:
(Click on the chart for a larger version)
The A-B-C pattern nicely fits into a new tramline pair, as marked. The touch-points, marked by my green arrows, are textbook!
The new lower tramline (the heavier line) closely follows the old' one, and provides added support.
So as of now, the market has fallen into good support, and so a good trade would be for me to enter resting short-selling orders just below the two tramlines in anticipation of the possible large decline, as forecast by my Elliott wave analysis.
Of course, some traders will have jumped the gun and shorted near the wave C high!
A possible target for the euro
OK, I'll try to come up with a possible target, if this potential trade works out as planned.
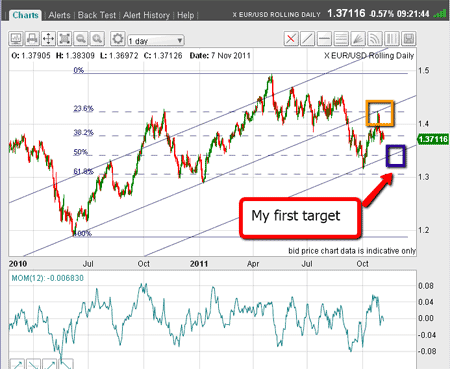
Here is the daily euro chart going back eight months:
(Click on the chart for a larger version)
The chart contains some very useful information!
The recent rally has carried to the Fibonacci 23.6% retrace of the big move from the June low to the May high. That is where it met the underside of my centre tramline in a classic 'kiss'.
Also, the drop to the 3 October low took it right to my lower tramline, thus confirming its validity as a line of support.
If this support is still operative from here, any move down to it should be met with good support. Also note the tramline is crossing the 50% Fibonacci level a few days from now. This 50% level should also provide solid support.
Thus, I think I have a very good case for suggesting that if the market can make it to this level, that would be a great place for me to take any short-term profits. This crossing will occur in mid-November in the 1.34 area.
How's that for using my simple chart-based analytical methods for producing a forecast for price and time!
Remember that markets rarely follow this exact a script, so I will be amazed if things work out this precisely. But it is a good template for me to work off.
Naturally, if the current tramline support holds, we shall see a bounce. But I will only need to re-asses my analysis if it can exceed wave C.
Later this week, I hope to cover the Dow and gold.
If you're a new reader, or need a reminder about some of the methods I refer to in my trades, then do have a look at my introductory videos:
The essentials of tramline trading
An introduction to Elliott wave theory
Don't miss my next trading insight. To receive all my spread betting blog posts by email, as soon as I've written them, just sign up here .