When to pull the trigger on a trade
Swing trading is a bit like a hunter stalking its prey, says John C Burford. You have to know exactly when to go in for the kill.
Get the latest financial news, insights and expert analysis from our award-winning MoneyWeek team, to help you understand what really matters when it comes to your finances.
You are now subscribed
Your newsletter sign-up was successful
Want to add more newsletters?

Twice daily
MoneyWeek
Get the latest financial news, insights and expert analysis from our award-winning MoneyWeek team, to help you understand what really matters when it comes to your finances.

Four times a week
Look After My Bills
Sign up to our free money-saving newsletter, filled with the latest news and expert advice to help you find the best tips and deals for managing your bills. Start saving today!
Swing trading is very much like a hunter stalking a prey. You need to tread carefully and only fire when the prey is well in your sights with little chance of missing.
Because a hunter has a rifle and knows there are deer in the vicinity, that doesn't mean he or she can open up on anything that moves. That would be a waste of expensive ammunition!
So it is with trading. Shooting off trades willy-nilly is a guaranteed way to waste your trading funds (ammunition). Like a hunter, your trades must be stalked and then you open fire only when there is little room for error.
MoneyWeek
Subscribe to MoneyWeek today and get your first six magazine issues absolutely FREE

Sign up to Money Morning
Don't miss the latest investment and personal finances news, market analysis, plus money-saving tips with our free twice-daily newsletter
Don't miss the latest investment and personal finances news, market analysis, plus money-saving tips with our free twice-daily newsletter
So today, I want to take you through this process by showing you a trade I am stalking in the Dow.
Markets rarely cooperate
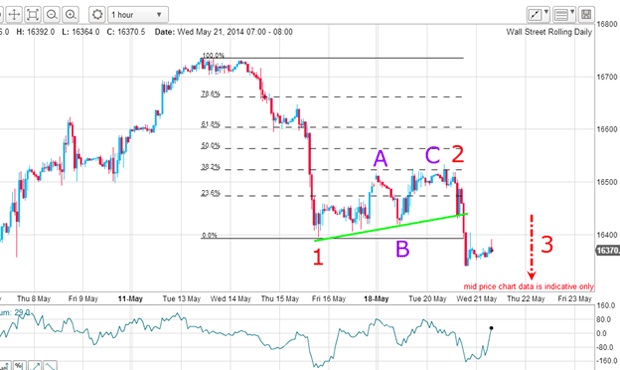
I had already identified the wave 1 as an impulsive five-wave move with an extended fifth wave. The rally off that low was in a clear A-B-C form with equality of the A and C waves. The scene looked set for an immediate resumption of the downtrend.
But markets are rarely so cooperative! We often find twists and turns that spoil the expected immediate outcome. And so it was after I wrote Wednesday's post. The huge rally that day caused me to amend my Elliott wave labels, but it still hasn't erased the message of the original five down off the 14 May high.
And that message remains that with high probability, the top is in and rallies are counter-trend.
Where is the market headed?
Here is the first (and my favourite):
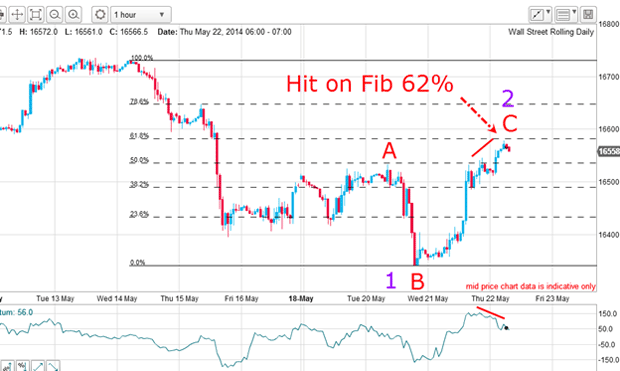
This was the picture yesterday morning. The move down to last Thursday's low is a valid impulsive five waves down and now the relief rally is a large A wave (which contains my original A-B-C). The new low is a B wave, and the rally to yesterday's high is my C wave. This is also a valid Elliott wave count.
When I took that screenshot yesterday, the market had retraced a precise Fibonacci 62% of the entire decline to the B wave low. This is the most common place where relief moves terminate and that gave me confidence the rally had stopped there.
This was a natural place for me to enter a short trade, expecting the decline to resume.
My protective stop could then be entered very close to entry and placed a few pips above the Fibonacci 62% level for a very low-risk trade. Remember, I am only interested in trades where I can enter a close (and logical) stop. That is a key requirement. The prey must be well in my sights!
Also, the C wave was a five-wave affair with a good negative-momentum divergence at the fifth wave. Here it is in close-up on the 15-minute chart:
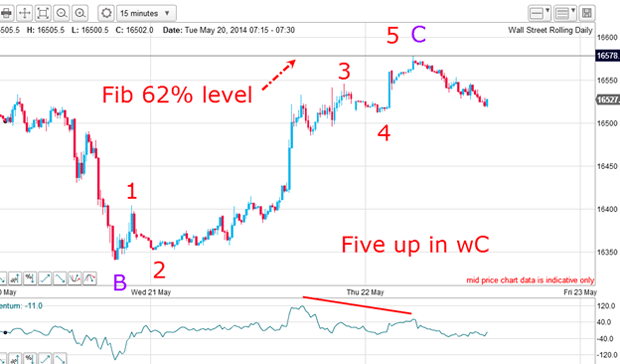
And even the third wave contains a clear five sub-wave pattern, as per textbook.
The market was retreating from the Fibonacci 62% level and the trade was going to plan.
Surprises can spoil the party
Here is the picture this morning on the 15-minute chart:
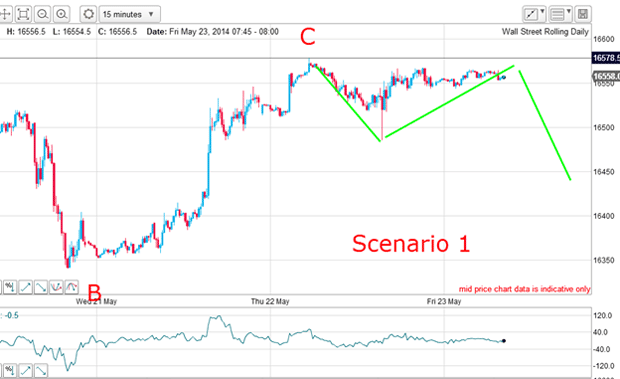
If the Fibonacci 62% level will hold, then the market will start to move down off current levels. A move below yesterday's low would confirm this picture.
But because of the spike move yesterday, which shows up well on the chart, good buying entered at that point, and that may be enough to propel the market up to the next Fibonacci level, the 78% level.
Be prepared for anything
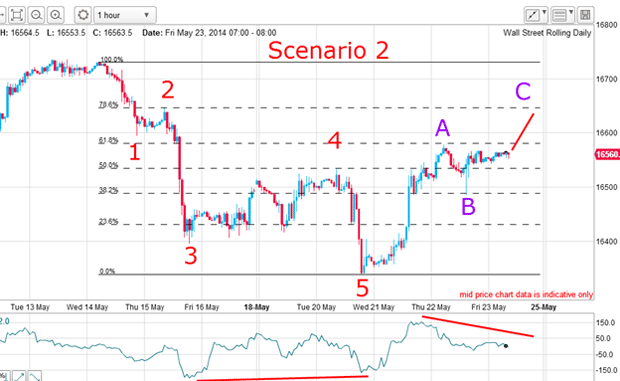
I have re-labelled the five waves down. The rally off wave 5 is an A-B-C with wave C in progress.
If the 62% level is breached, the next target is the 78% level or perhaps the 2/3 level and if a negative-momentum divergence appears at that point, that would most likely indicate the rally termination.
That means of course, that my protective stop would be hit and I would suffer that loss albeit a planned small one which is well within my 3% rule.
So now, I have to wait for what the market offers up. But I am prepared for any eventuality and that is what a trader must always do.
Trading on hope is all too often the style adopted by many. This is a formula for failure. Hope springs eternal in most areas of life, but not in trading.
Incidentally, no deer were harmed in writing this post.
Get the latest financial news, insights and expert analysis from our award-winning MoneyWeek team, to help you understand what really matters when it comes to your finances.
John is is a British-born lapsed PhD physicist, who previously worked for Nasa on the Mars exploration team. He is a former commodity trading advisor with the US Commodities Futures Trading Commission, and worked in a boutique futures house in California in the 1980s.
He was a partner in one of the first futures newsletter advisory services, based in Washington DC, specialising in pork bellies and currencies. John is primarily a chart-reading trader, having cut his trading teeth in the days before PCs.
As well as his work in the financial world, he has launched, run and sold several 'real' businesses producing 'real' products.
-
 Can mining stocks deliver golden gains?
With gold and silver prices having outperformed the stock markets last year, mining stocks can be an effective, if volatile, means of gaining exposure
-
 8 ways the ‘sandwich generation’ can protect wealth
People squeezed between caring for ageing parents and adult children or younger grandchildren – known as the ‘sandwich generation’ – are at risk of neglecting their own financial planning. Here’s how to protect yourself and your loved ones’ wealth.