Wednesday was my best Dow trading day in a year
The Dow Jones index has just had one of its most volatile weeks for a long time. John C Burford explains how he cleaned up.
Get the latest financial news, insights and expert analysis from our award-winning MoneyWeek team, to help you understand what really matters when it comes to your finances.
You are now subscribed
Your newsletter sign-up was successful
Want to add more newsletters?

Twice daily
MoneyWeek
Get the latest financial news, insights and expert analysis from our award-winning MoneyWeek team, to help you understand what really matters when it comes to your finances.

Four times a week
Look After My Bills
Sign up to our free money-saving newsletter, filled with the latest news and expert advice to help you find the best tips and deals for managing your bills. Start saving today!
Last Friday, I said "January is shaping up to be a most lively trading month".
That turned out to be an understatement. Last week, the Dow Jones index had one of its most volatile weeks in years. A trader's dream!
Trading in this scenario is certainly heart-stopping, but potentially very profitable for the nimble trader. Get it right, and you can rack up gains of 200 to 400 pips or more in a few hours.
MoneyWeek
Subscribe to MoneyWeek today and get your first six magazine issues absolutely FREE

Sign up to Money Morning
Don't miss the latest investment and personal finances news, market analysis, plus money-saving tips with our free twice-daily newsletter
Don't miss the latest investment and personal finances news, market analysis, plus money-saving tips with our free twice-daily newsletter
Today, I want to talk you through how I did just that during Wednesday's incredible roller-coaster action.
How to bet against the crowd
There was a lively start to the week. On Monday, the Dow had a 100-pip rally and then a swift 200-pip decline. And on Tuesday the market rallied as a result of some strong earnings reports from the companies which comprise the Dow index.
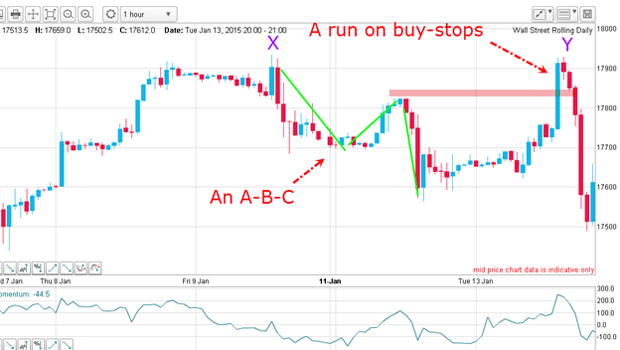
This was the picture on Tuesday afternoon:

The massive rally to above 17,900 point Y on my graph knocked out thousands of automatic buy-stops (buy stops protect short sellers by limiting their losses as the markets rise). This running of the stops' is a common feature of markets.
But the important point from my perspective is that the rally fell ten pips short of last Friday's high. The high at point Y was ten pips under the high at X.
Why did that matter to me? It meant my original Elliott wave labels from my analysis earlier in January were still intact. You see, if the rally had carried beyond Friday's high, my Elliott wave labels would need to be amended.
This told me what I needed to know the market was heading down.
Elliott wave theory told me my target
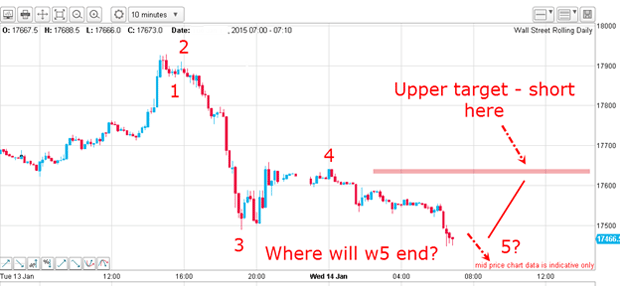
On Wednesday, the market rallied and then fell to a new low, which set up a lovely five-wave Elliott wave pattern. It's shown below in the ten-minute chart:

I took that screenshot early on Wednesday, just as the fifth Elliott wave was about to make its turn.
At that point we were at the fifth wave which is the end of a complete Elliott wave pattern. Elliott wave theory says that when the fifth wave ends, the next move is likely to be a relief rally. But where exactly would the fifth wave end? That was the burning question.
How I called the bottom
You see, relief rallies often end at or near the previous wave 4 high (which, in this case, was at the 17,640 level). And what's more, theory says that relief rally would likely be an A-B-C form (ie, showing three changes of direction within the overall trend).
So I had everything I needed to place a low-risk trade: short at the 17,640 area and place a close stop just above.
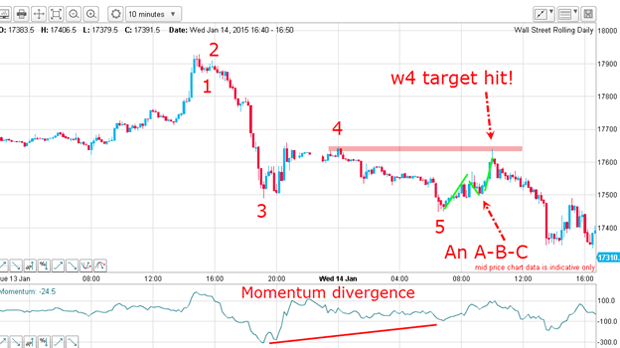
Let's see how this forecast worked out:

The rally hit my target of 17,640 right on the nose, before the market fell hard. What a fantastic demonstration of the power of Elliott wave theory!
How much should I cash out?
How much should you hedge your bets by locking in profits, in this situation?
This is where your own time horizon comes in. If you are a longer-term trader looking for a very large move, you will not be so concerned with the rallies, provided your original stop loss is not hit.
If you are more of a day trader, you will be looking to exit on the first sign of strength and will not sit through a large adverse move. Such moves often turn out to be far larger than you expect or hope.
So although I write here about trade entries and the methods I use to give me low-risk trades, entering the trade is relatively the easy part. It is the trade management deciding how much to cash out, and when that gives you the headaches.
A note on the Swiss central bank action
So much for bankers' promises and I hope you were not among the victims.
Because this currency is always highly manipulated, I never advise trading it and rarely bring up the chart to illustrate a point. Recent action has confirmed the wisdom of avoiding it.
Get the latest financial news, insights and expert analysis from our award-winning MoneyWeek team, to help you understand what really matters when it comes to your finances.
John is is a British-born lapsed PhD physicist, who previously worked for Nasa on the Mars exploration team. He is a former commodity trading advisor with the US Commodities Futures Trading Commission, and worked in a boutique futures house in California in the 1980s.
He was a partner in one of the first futures newsletter advisory services, based in Washington DC, specialising in pork bellies and currencies. John is primarily a chart-reading trader, having cut his trading teeth in the days before PCs.
As well as his work in the financial world, he has launched, run and sold several 'real' businesses producing 'real' products.
-
 Should you buy an active ETF?
ETFs are often mischaracterised as passive products, but they can be a convenient way to add active management to your portfolio
-
 Power up your pension before 5 April – easy ways to save before the tax year end
With the end of the tax year looming, pension savers currently have a window to review and maximise what’s going into their retirement funds – we look at how