The Dow Jones reaches another Fibonacci level
Tuesday's reversal of fortunes in the Dow Jones came as no surprise to those who could read the signs, says spread betting trader John C Burford.
Get the latest financial news, insights and expert analysis from our award-winning MoneyWeek team, to help you understand what really matters when it comes to your finances.
You are now subscribed
Your newsletter sign-up was successful
Want to add more newsletters?

Twice daily
MoneyWeek
Get the latest financial news, insights and expert analysis from our award-winning MoneyWeek team, to help you understand what really matters when it comes to your finances.

Four times a week
Look After My Bills
Sign up to our free money-saving newsletter, filled with the latest news and expert advice to help you find the best tips and deals for managing your bills. Start saving today!
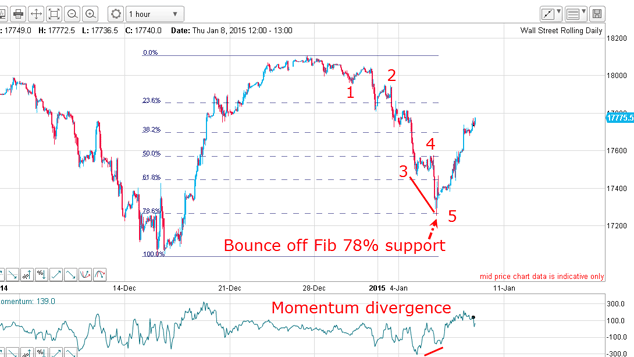
The first few days of January were hard down for stocks in a lovely textbook five-wave affair, bolstering my belief that the December tops were in.
But because nothing is 100% certain in market analysis, we must leave open the possibility that the markets may not have finished the almost six-year rally off the 2009 lows. That must always be kept in mind.
And since the lows of Tuesday, the markets have staged one of their characteristic deep upward retracements.
MoneyWeek
Subscribe to MoneyWeek today and get your first six magazine issues absolutely FREE

Sign up to Money Morning
Don't miss the latest investment and personal finances news, market analysis, plus money-saving tips with our free twice-daily newsletter
Don't miss the latest investment and personal finances news, market analysis, plus money-saving tips with our free twice-daily newsletter
But Tuesday's reversal was well flagged to those traders who could read the signs:

The market made an accurate hit on the Fibonacci 78% leveland on a large positive momentum divergence.That is all I needed to tell me to lighten up on my short trades for a gain of over 600 pips.
Remember, a momentum divergence indicates that the motive power behind the trend is weakening. Here, the selling was drying up and if it persisted, the buying would be enough to reverse the trend, as did occur.
The move down was terminated with a lovely positive momentum divergence one of the tell-tale signs I look for when knowing to expect a reversal.
Now, if you use my split bet strategy, you could take half off and leave the other half open with protective stop moved to break even. Then, you would be free to re-instate the other half position on the subsequent rally.
When will the market turn?
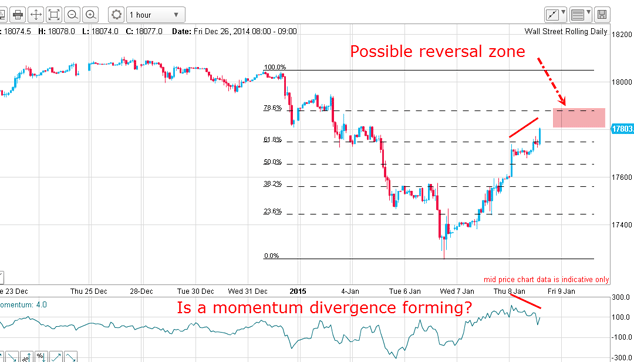
This was the picture at mid-afternoon yesterday:

For traders looking to short on this rally, the burning question is this: when will it turn?
For the past few years, retracements off highs have been generally deep above the 62% level, and some have been above the 90% level. So we should not be surprised if we see another such event this time.
That was the main reason I had for expecting the rally to be deeper than 62% and so it has proved.
This could be a great place for a reversal
The absurdity of such logical contortions is readily apparent when you look over at the euro. If this logic is correct, the euro would be expected to decline instead, it rose yesterday! How do you square that?
As sharp-eyed traders we can use this information to our advantage. If the euro did not decline on this news' and stocks rose, is the path of least resistance for the euro now up (see Wednesday's article)?
But now at mid-afternoon yesterday, the market is heading for the Fibonacci 66%-78% zone (pink area). If it stalls out there and a negative momentum divergence could form, that would be a great place to look for a reversal.
January is shaping up to be a lively month

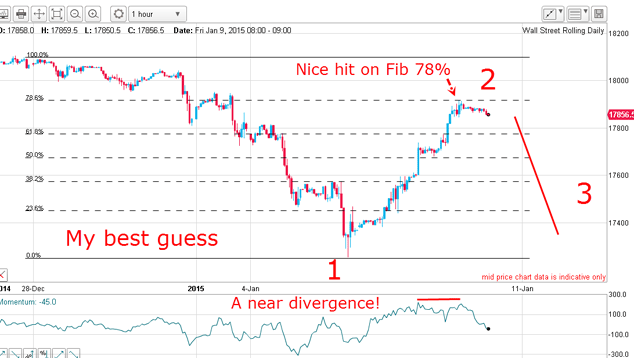
The market did make an accurate hit on the Fibonacci 78% level but with no clear momentum divergence, although a flat red line is encouraging because the sharp rally yesterday could not produce a higher reading. That was a moral victory!
But that Fibonacci 78% hit is the mirror image of the previous retracement in a lovely show of market symmetry thanks to Sr Fibonacci.
That places the larger Elliott wavelabels in a very interesting light. The wave 2 rally is not a clear A-B-C, which would have been ideal. Rather, it is a series of several over-lapping small waves.
So, if the relief rally has indeed run its course or will do soon we should be at the start of a large third wave down. Remember, third waves are long and strong and would take the market well below the wave 1 low.
The implications of this scenario are vital for the outlook in other markets in particular the euro. In Wednesday's article,I outlined my case that the EUR/USD is so unloved with only 4% bulls that it is highly vulnerable to a short squeeze. And if this pans out, it would fit in perfectly with a declining stock market.
January is shaping up to be a most lively trading month!
Get the latest financial news, insights and expert analysis from our award-winning MoneyWeek team, to help you understand what really matters when it comes to your finances.
John is is a British-born lapsed PhD physicist, who previously worked for Nasa on the Mars exploration team. He is a former commodity trading advisor with the US Commodities Futures Trading Commission, and worked in a boutique futures house in California in the 1980s.
He was a partner in one of the first futures newsletter advisory services, based in Washington DC, specialising in pork bellies and currencies. John is primarily a chart-reading trader, having cut his trading teeth in the days before PCs.
As well as his work in the financial world, he has launched, run and sold several 'real' businesses producing 'real' products.
-
 Average UK house price reaches £300,000 for first time, Halifax says
While the average house price has topped £300k, regional disparities still remain, Halifax finds.
-
 Barings Emerging Europe trust bounces back from Russia woes
Barings Emerging Europe trust has added the Middle East and Africa to its mandate, delivering a strong recovery, says Max King