Everyone hates the euro – is it time for a big rally?
When you find most traders agree with you on your trade, you know it's time to looks for the exits, says John C Burford.
Get the latest financial news, insights and expert analysis from our award-winning MoneyWeek team, to help you understand what really matters when it comes to your finances.
You are now subscribed
Your newsletter sign-up was successful
Want to add more newsletters?

Twice daily
MoneyWeek
Get the latest financial news, insights and expert analysis from our award-winning MoneyWeek team, to help you understand what really matters when it comes to your finances.

Four times a week
Look After My Bills
Sign up to our free money-saving newsletter, filled with the latest news and expert advice to help you find the best tips and deals for managing your bills. Start saving today!
One of the sure-fire - yet simple - ways to judge market sentiment is to scan the headlines of the financial press. When you see a torrent of bearish (or bullish) themes using dramatic language, odds are that the trend is ending at least temporarily.
As a swing trader, I am always nervous when I am with a position and discover that everyone agrees with me! That is when I start looking the exits. Of course, even if you expect a reversal soon, there are few clues as to how far the retracement will go.
That is why I devised my split-bet strategy. If I believe there is probably more to go for but expect a reversal, I can take half of my position off at a profit and leave the other half open. I then move my protective stop on the remainder to break-even, or possibly to a point which guarantees a profit on that remaining position.
MoneyWeek
Subscribe to MoneyWeek today and get your first six magazine issues absolutely FREE

Sign up to Money Morning
Don't miss the latest investment and personal finances news, market analysis, plus money-saving tips with our free twice-daily newsletter
Don't miss the latest investment and personal finances news, market analysis, plus money-saving tips with our free twice-daily newsletter
Using this strategy, I am then relieved of the stress of making the decision whether to take full profits or not.
How to get back on the moving train
So, one of the ways I judge when a trend is about to run its course at least temporarily is to scan the headlines and note the language.
For instance, headlines are full of the shock treatment of the sudden' and unexpected' fall in stock markets since the start of the year. Evidently, it has taken the media by total surprise. And no wonder I could not see one New Year article that forecast a down year for stocks for 2015. That is as bullish as it gets and a major sign for a top.
Their desperation to find reasons' for the January slide has reached comic proportions when all they can offer is the simple-minded observation that oil is crashing'. Well, oil started crashing six months ago yet stocks continued to rally, so that blows that excuse out of the water.
Following this logic, when oil started crashing last summer, a valid trade was to start shorting stocks then. Sadly, this would not have been terribly successful.
My advice? If you must read the media, consider it as entertainment, not as a source of insightful information (except as a contrary indicator).
No, stocks started their slide because a completed Elliott wave pattern had formed at the top where bullish sentiment was off the scale. I have shown several charts of the Dow and S&P recently to illustrate how you could have positioned yourself correctly in anticipation of the January slide.
The euro bulls have all but vanished
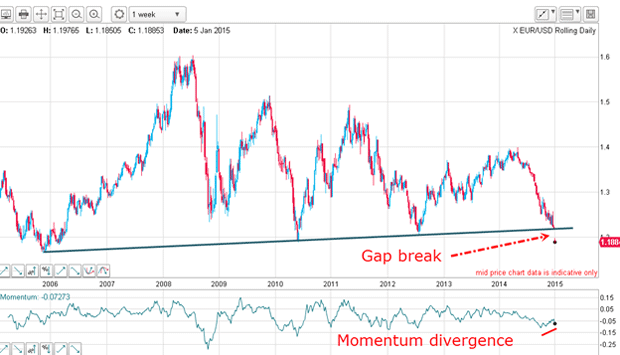
That is one of the main rationalisations given by pundits to explain the relentless decline in EUR/USD from the 1.40 level last May to the recent 1.19 level a decline of 15% in purchasing power.
Naturally, with the DSI (daily sentiment index) bullish reading at a wafer-thin 4%, I have to start examining the charts for signs of a reversal. With euro bulls having vanished, this market is like a parched forest just waiting for a spark to send it up in flames. The firefighters in the shape of the ECB will have their hands full trying to extinguish it.
Could this be the spark that sets the fire?

When the market opened on Sunday night it gapped down as the nine-year support line gave way. My guess is that this action drew even more to the bearish side.
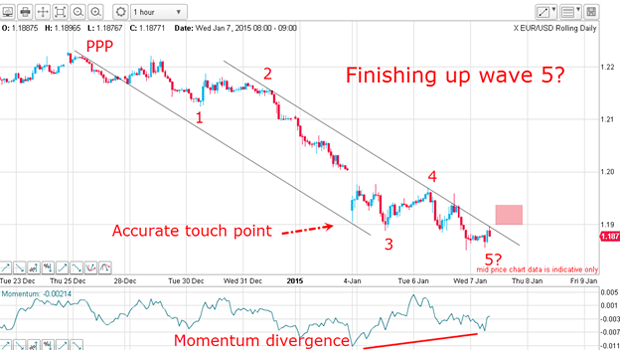
With no bulls in sight, let's look at the hourly chart:

The latest move down appears to be in the last stages of wave 5. And I have a lovely tramline pair working. I am impressed particularly by the very accurate spike low touch point on the lower tramline.
Momentum is steadily building, indicating a weakening of selling pressure and if the market can rally up past the upper tramline into the pink zone, could that be the spark that sets off the forest fire?
Get the latest financial news, insights and expert analysis from our award-winning MoneyWeek team, to help you understand what really matters when it comes to your finances.
John is is a British-born lapsed PhD physicist, who previously worked for Nasa on the Mars exploration team. He is a former commodity trading advisor with the US Commodities Futures Trading Commission, and worked in a boutique futures house in California in the 1980s.
He was a partner in one of the first futures newsletter advisory services, based in Washington DC, specialising in pork bellies and currencies. John is primarily a chart-reading trader, having cut his trading teeth in the days before PCs.
As well as his work in the financial world, he has launched, run and sold several 'real' businesses producing 'real' products.
-
 Should you buy an active ETF?
ETFs are often mischaracterised as passive products, but they can be a convenient way to add active management to your portfolio
-
 Power up your pension before 5 April – easy ways to save before the tax year end
With the end of the tax year looming, pension savers currently have a window to review and maximise what’s going into their retirement funds – we look at how