Was Thursday 'D-Day' for the euro?
News from the European Central Bank produced a surge in the market. John C Burford plots the euro's likely course in the charts.
Get the latest financial news, insights and expert analysis from our award-winning MoneyWeek team, to help you understand what really matters when it comes to your finances.
You are now subscribed
Your newsletter sign-up was successful
Want to add more newsletters?

Twice daily
MoneyWeek
Get the latest financial news, insights and expert analysis from our award-winning MoneyWeek team, to help you understand what really matters when it comes to your finances.

Four times a week
Look After My Bills
Sign up to our free money-saving newsletter, filled with the latest news and expert advice to help you find the best tips and deals for managing your bills. Start saving today!
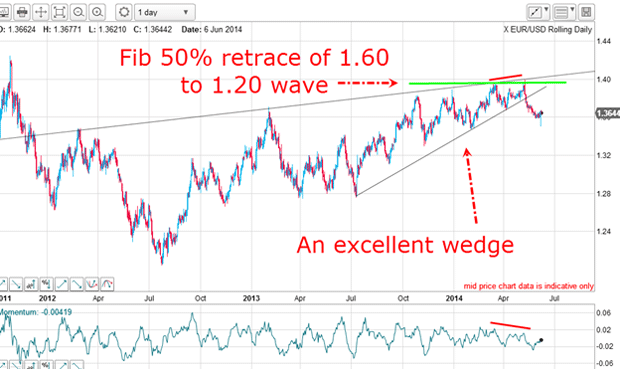
The dollar has been in rally mode for the last few weeks, putting pressure on the EUR/USD. My last post on the euro was over two months ago and during that time, the EUR/USD has managed to carry to the 1.40 level that's a Fibonacci 50% retrace of the big move from the 2008 high and the most recent 2010 low.
But when it hit the 1.40 level, it hit a brick wall, and it has been straight down since then until last week.
That was when the European Central Bank (ECB) delivered its big bazooka' to fight the looming prospect of deflation in Europe. The 70th anniversary of the Normandy invasion was commemorated on 6 June, but was Thursday, 5 June the modern D-Day 'D' for deflation?
MoneyWeek
Subscribe to MoneyWeek today and get your first six magazine issues absolutely FREE

Sign up to Money Morning
Don't miss the latest investment and personal finances news, market analysis, plus money-saving tips with our free twice-daily newsletter
Don't miss the latest investment and personal finances news, market analysis, plus money-saving tips with our free twice-daily newsletter
I will examine the charts today, because they have been throwing up some terrific trading ideas based on my methods.
This is one of my favourite trade set-ups

The move to the 1.40 level occurred on a negative-momentum divergence, thereby giving warning that a top was very likely nearby. Remember, a negative-momentum divergence indicates that the buying force propelling the market higher is weakening and at some stage, selling will take over as the driving force. That is where I seek a low-risk entry.
Also, I have an excellent wedge with the lower line drawn from the July 2013 low, which has four accurate touch points, making it a reliable line of support.
Likewise, the upper wedge line of resistance has five accurate touch points with the final one being the 1.40 top. This is a textbook wedge pattern.
I like wedges in fact, the wedge is one of my five favourite trade set-ups.
And using just this information - and knowing nothing about the feverish speculation swirling about the market of the possible moves to be taken by the ECB in their time-certain 5 June meeting announcement a short trade was a low-risk opportunity.
The market gives us a very reliable entry point
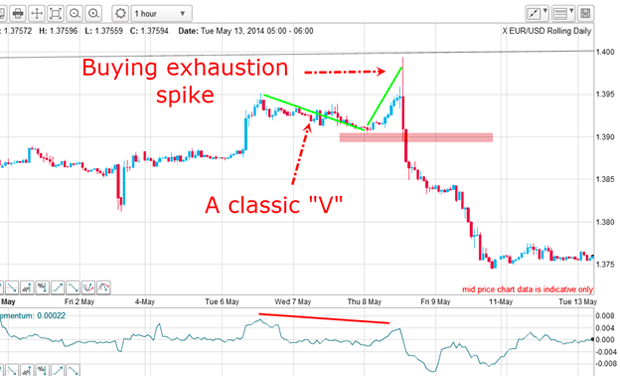
Here is the hourly chart:

But if you were paying attention at this time, there is a lovely 'V' pattern, which was validated by the move below the apex of the 'V' (pink bar). This is the usual place where I enter sell-stops and these often give a high-reliability entry where my trade is never in a loss.
This is the most satisfying trade entry method I use, which means that I can quickly move my protective stop to break-even, following my money management rule.
Where to enter your protective stop
But the trade is so compelling that I would use a money stop of my usual 50 60 pips. I believe that if I am taken out here, the market may well have more work to do around the 1.40 level. And my forecast for an immediate plunge would be in jeopardy.
Note that I move my stop to break-even after the market has moved by at least 100% of my original stop. This move can keep you out of serious trouble if the market suddenly reverses, which is always a possibility that you have to keep in mind.
What I am trying to do is to align myself with a potentially profitable move in my direction. I do not own a crystal ball only fair-ground fortune-tellers have those. I have no more knowledge of the next market move than anyone else.
All I have in my arsenal is the knowledge that on average, such set-ups have produced a favourable trade. I stress the phrase on average', because next time, it may not work out.
As Damon Runyon famously said: "The race isn't always to the swift, nor the battle to the strong, but that's the way to bet".
Short the news, cover the rumour
Prior to the top, the market was very long meaning, the speculators were holding a large net long futures position (available from the commitment of traders (COT) data). This was the forced selling that fuelled the steep declines.
It was long liquidation that propelled the market to the 1.35 level last week a huge drop of five cents in a month. But then on Thursday, as the ECB news emerged, the market staged a huge rally in a classic short the news, cover on the rumour' event.
My best guess for what will happen next

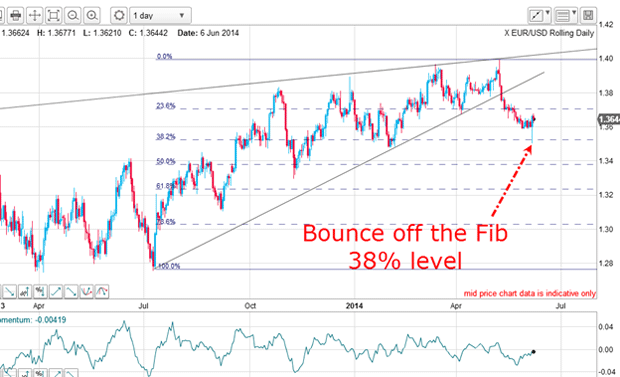
Isn't that pretty? The Fibonacci 38% support level did its work and turned the market back up.
Thursday's late rally has produced a key reversal on the day, as occurred at the 1.40 top. A key reversal is when the market makes a new low/high and closes up/down on the day, compared with the previous day's close.
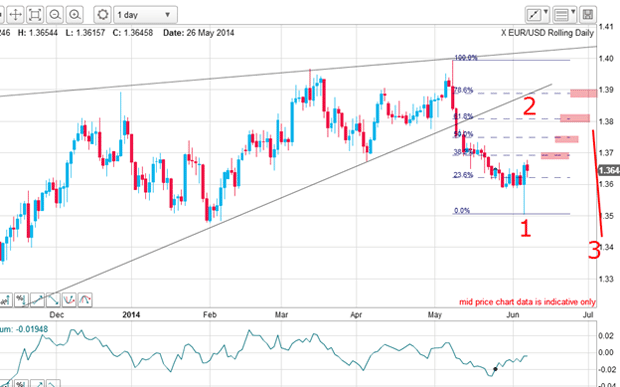
If the market has now embarked on a large move down, I can apply Elliott-wave labels:

Thursday's low is my wave 1 and we are now in wave 2, which could end at one of the Fibonacci levels marked. After wave 2 tops, the market would then be in a long and strong wave 3 down. That is my best guess at this point.
There is a possibility a large wave 2 rally could kiss the wedge line in the 1.39 area. This potential cannot be dismissed, but there is lots of overhead resistance standing in the way which could prevent that.
The odds favour a shallower retracement, but when wave 2 does top out, the move down in wave 3 should be huge. A break of the 1.35 level should confirm this scenario.
Get the latest financial news, insights and expert analysis from our award-winning MoneyWeek team, to help you understand what really matters when it comes to your finances.
John is is a British-born lapsed PhD physicist, who previously worked for Nasa on the Mars exploration team. He is a former commodity trading advisor with the US Commodities Futures Trading Commission, and worked in a boutique futures house in California in the 1980s.
He was a partner in one of the first futures newsletter advisory services, based in Washington DC, specialising in pork bellies and currencies. John is primarily a chart-reading trader, having cut his trading teeth in the days before PCs.
As well as his work in the financial world, he has launched, run and sold several 'real' businesses producing 'real' products.
-
 Average UK house price reaches £300,000 for first time, Halifax says
While the average house price has topped £300k, regional disparities still remain, Halifax finds.
-
 Barings Emerging Europe trust bounces back from Russia woes
Barings Emerging Europe trust has added the Middle East and Africa to its mandate, delivering a strong recovery, says Max King