Trusting your gut won’t make you any money
Leave your instincts at the door, says John C Burford. Let your tried and tested trading methods do the work for you.
Get the latest financial news, insights and expert analysis from our award-winning MoneyWeek team, to help you understand what really matters when it comes to your finances.
You are now subscribed
Your newsletter sign-up was successful
Want to add more newsletters?

Twice daily
MoneyWeek
Get the latest financial news, insights and expert analysis from our award-winning MoneyWeek team, to help you understand what really matters when it comes to your finances.

Four times a week
Look After My Bills
Sign up to our free money-saving newsletter, filled with the latest news and expert advice to help you find the best tips and deals for managing your bills. Start saving today!
Today, I've written about the S&P 500. But before I get to my current take on the stockmarkets, I thought I would share a gem I found in the media. I found a real doozy this week on Bloomberg.
The shares of commodity trading giant Glencore have been in free-fall for some time (from the £3 area in May to the current 80p range a terrific decline of a near-Fibonacci 73%, please note).
These were the headlines:
MoneyWeek
Subscribe to MoneyWeek today and get your first six magazine issues absolutely FREE

Sign up to Money Morning
Don't miss the latest investment and personal finances news, market analysis, plus money-saving tips with our free twice-daily newsletter
Don't miss the latest investment and personal finances news, market analysis, plus money-saving tips with our free twice-daily newsletter
Monday: "Glencore crashes as analysts fear the shares have no value"
Tuesday: "Glencore rallies as analysts say the plunge is overdone"
If the journalist had written this on Monday: "Glencore due for rally as analysts say the plunge is overdone", they would have given us something useful. Sadly, this kind of lazy journalism is all too rife and is merely a semi-rational explanation of what has already happened that day.
It is as if they have a filing cabinet full of stock headlines they pull out and fill in the blanks one set for an already-completed rally and another for a plunge.
Of course, as traders, we must anticipate market moves, not find excuses afterwards. And that is where a solid system such as my tramline system can pinpoint those great trading opportunities, independent of the media.
That said, the media can be very useful in predicting market turnarounds, as they seem almost invariably to get the markets wrong. In recent days, I have been seeing more gloom-and-doom headlines, such as today's "World set for emerging market mass default". I sense a decent rally approaching.
A classic counter-trend pattern showed me where the market was going
how the buy-the-dip boys were doing
Since 2009, that has been the default position of investors/gamblers. They believed the Fed had their backs covered and they did, with a constantstream of almost- free quantitative easing (QE) funds. After all, those QE dollars were not heading for Main Street, so the bankers had to do something with them and they certainly took full advantage!
But has the game changed now? Has the Fed lost its magic? And will the buy-the-dip boys get wiped out this time?
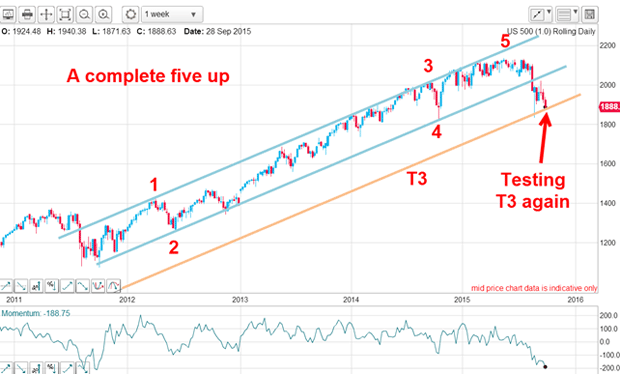
Let's look at the S&P 500 index, which is an all-purpose index of the 500 biggestUS corporations in a wide variety of sectors. Below is the weekly chart to remind us of context. The entire rally from the 2011 lows is in a clear five-up and travelled in the trading channel contained within my blue tramlines. As wave 5 was completing in May, momentum was weakening and gave a clue that the end was nigh.
And in August, the market crashed through the lower tramline. This was a clear signal that the main trend was now down.

But the plunge halted right at T3 which is my third tramline drawn equidistant. Recall, I always draw T3 in whenever a tramline is broken. That gives me my likely target and was spot on here as a place to take at least partial profits on shorts for a very large gain.
Let's take a closer look on the daily chart:

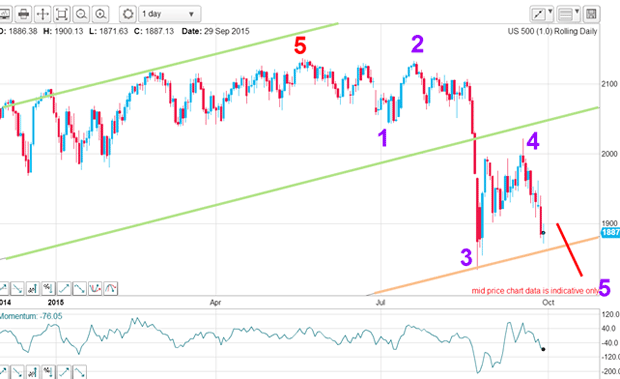
From the wave 5 high in May, I have waves 1, 2, 3, 4 of a potential five down. My wave 3 is long and strong and wave 4 sports a classic A-B-C counter-trend pattern (see Monday's post for the equivalent pattern in the FTSE).
So now, we are in the final wave 5 down but the path won't be straight.

To forecast where the twists and turns may occur and where short-term traders can look to take profits I can turn to my tried and true Fibonacci method.
A closer look at the S&P
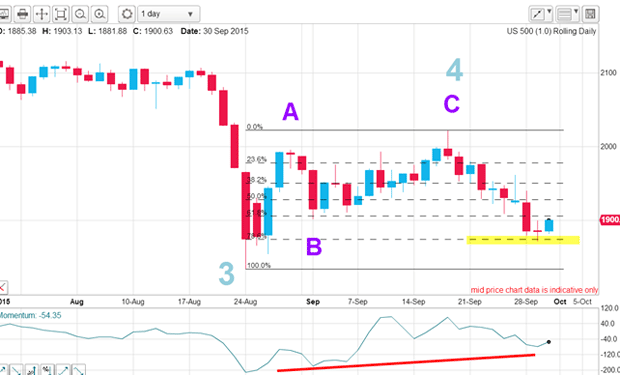
Recall, the Fibonacci levels shown are drawn off the August 24 plunge low as pivot point, which was a spike low (as was the spike high in wave C):

The point is this: even with fleeting highs and lows that are made during extreme market volatility (when emotions are running high), the prices marked as lows and highs remain highly significant for Mr Fibonacci to do his excellent work!
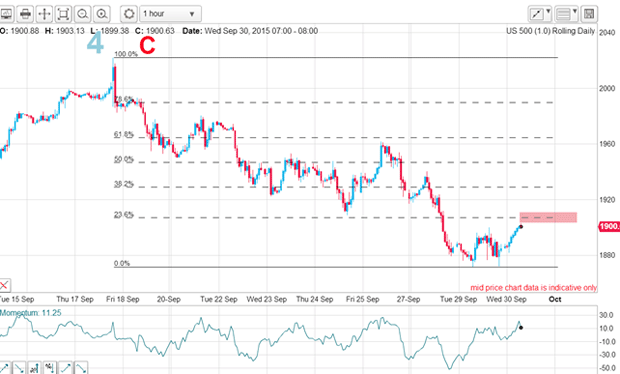
This morning, the rally has extended, lending weight to the conclusion that the combination of Fibonacci level and large-momentum divergence will likely lead to a strong counter-trend rally. Here is the current hourly chart showing the likely Fibonacci targets for the bounce:

The first is the Fibonacci 23% level just ahead with higher levels possible.
I have identified a bounce in wave 5 at the 1,880 area and that is where short-term profits of around 100 full points were available from the short trade taken near the C wave high.
Get the latest financial news, insights and expert analysis from our award-winning MoneyWeek team, to help you understand what really matters when it comes to your finances.
John is is a British-born lapsed PhD physicist, who previously worked for Nasa on the Mars exploration team. He is a former commodity trading advisor with the US Commodities Futures Trading Commission, and worked in a boutique futures house in California in the 1980s.
He was a partner in one of the first futures newsletter advisory services, based in Washington DC, specialising in pork bellies and currencies. John is primarily a chart-reading trader, having cut his trading teeth in the days before PCs.
As well as his work in the financial world, he has launched, run and sold several 'real' businesses producing 'real' products.
-
 Can mining stocks deliver golden gains?
With gold and silver prices having outperformed the stock markets last year, mining stocks can be an effective, if volatile, means of gaining exposure
-
 8 ways the ‘sandwich generation’ can protect wealth
People squeezed between caring for ageing parents and adult children or younger grandchildren – known as the ‘sandwich generation’ – are at risk of neglecting their own financial planning. Here’s how to protect yourself and your loved ones’ wealth.