How to make smart trades in a difficult market
Keeping an open mind is vital when it comes to trading, says John C Burford. And let the market do the talking.
Get the latest financial news, insights and expert analysis from our award-winning MoneyWeek team, to help you understand what really matters when it comes to your finances.
You are now subscribed
Your newsletter sign-up was successful
Want to add more newsletters?

Twice daily
MoneyWeek
Get the latest financial news, insights and expert analysis from our award-winning MoneyWeek team, to help you understand what really matters when it comes to your finances.

Four times a week
Look After My Bills
Sign up to our free money-saving newsletter, filled with the latest news and expert advice to help you find the best tips and deals for managing your bills. Start saving today!
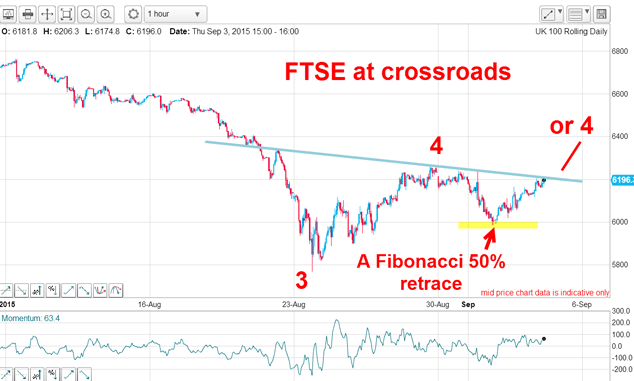
When I wrote my4Septemberpost, the FTSE was poised either to make one more stab at extending its rally, or just about to perform another leg down.
The reason I had that crossroads dilemma was because I knew the market was in a fourth wave up and these are commonly in the shape of an A-B-C three-wave affair. Either the C wave had terminated at the August 28 high or the rally off the Fibonacci 50% retrace might extend to make a new high. Both options were equally valid.
This was the chart I posted:
MoneyWeek
Subscribe to MoneyWeek today and get your first six magazine issues absolutely FREE

Sign up to Money Morning
Don't miss the latest investment and personal finances news, market analysis, plus money-saving tips with our free twice-daily newsletter
Don't miss the latest investment and personal finances news, market analysis, plus money-saving tips with our free twice-daily newsletter

If the rally did indeed extend, a break of my blue trendline was imminent. Normally, important trendline or tramline breaks can be relied on to herald a more substantial move away from the line. But sometimes, a break will simply mop up a few buy-stops and encounter heavier selling that drives the market back down to the line and beyond.
Many professional traders sell into this action in a process we call 'fading the market'. When they do, they test the strength of the buying power by observing the market's reactions in this period.
In fact, this was the very technique used by JL Livermore (as described in the classic book,Reminiscences of a Stock Operator a book I highly recommend to all traders/investors). In his day (the 1910s 1920s), the only means he had of following the market was the ticker tape machine. He would 'read the tape' as it spewed out to see what reaction was provoked by his exploratory trades.
If the market moved in his direction with force, he would be confident that he had the main trend correct. But if his trade was easily absorbed and the market showed little or no reaction, he would conclude that he was up against a brick wall and he would exit the trade.
That, in a nutshell, is a very good discipline for any trader to take on board, and today with the easy availability of PCs/tablets/smart phones that give us instant market quotes anywhere in the world, that process is so much easier than in Livermore's day.
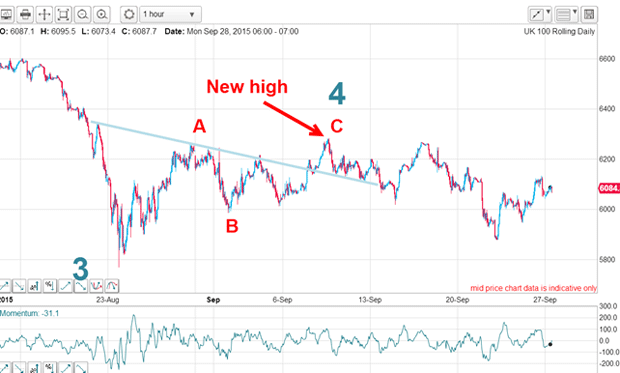
How did my dilemma resolve?

And since then, the market fell away as the sellers took control. There was another attempt by the bulls to push on upwards in mid-September, but they were unable to make a new high and the market fell heavily and is currently rallying a most complex picture!
But what I want to do now is to consider the current position of the market and to describe my thought process when I am confronted with this degree of complexity in any market.
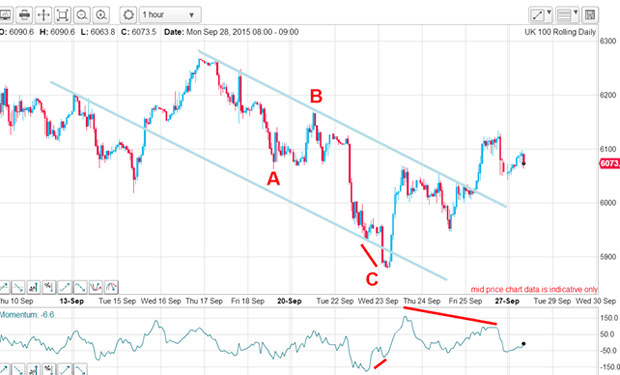
Here is the FTSE hourly chart as of this morning:

The move down off the September 17 high is in a clear A-B-C three wave pattern, implying the next move will be up. When I saw that very large positive-momentum divergence at last week's low, it was apparent a sharp rally was on the cards. And when the market broke above my upper blue tramline, that was a possible long trade signal.
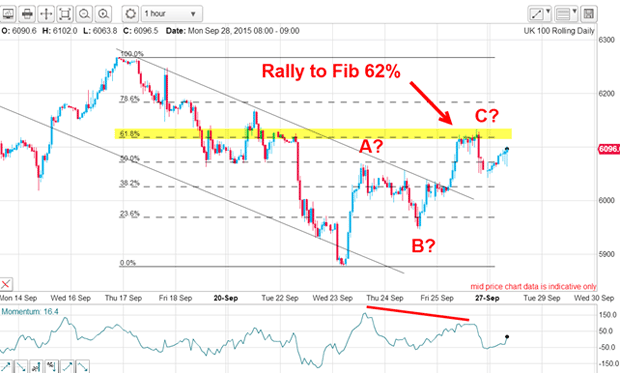
But so far, the rally is also only in three waves and thus in danger of petering out. But note where the rally has at least paused:

It carried to a very accurate hit on the Fibonacci 62% level in a textbook display and the place where profits could be taken on the long trade, and a new short trade initiated.
With the market rallying back this morning, the option for a move above Friday's high is very much open. That is because with Friday's tramline break, I have a valid upside target at T3, my third tramline drawn equidistant from the centre tramline. Lurking in the background is the present large momentum divergence that points to a relative weakness in the current rally.
So these are the cross-currents at play as I see them. And in terms of trading, I have my short trade working from the 6,120 area from Friday, but I have moved my protective stop to break even just in case.
What I have done is acknowledge the high level of uncertainty in the wave count, have placed a trade based on solid tramline trading principles, moved my stop to break even, and await developments. That is all a trader can do and I will now let the market speak.
Get the latest financial news, insights and expert analysis from our award-winning MoneyWeek team, to help you understand what really matters when it comes to your finances.
John is is a British-born lapsed PhD physicist, who previously worked for Nasa on the Mars exploration team. He is a former commodity trading advisor with the US Commodities Futures Trading Commission, and worked in a boutique futures house in California in the 1980s.
He was a partner in one of the first futures newsletter advisory services, based in Washington DC, specialising in pork bellies and currencies. John is primarily a chart-reading trader, having cut his trading teeth in the days before PCs.
As well as his work in the financial world, he has launched, run and sold several 'real' businesses producing 'real' products.
-
 Last chance to invest in VCTs? Here's what you need to know
Investors have pumped millions more into Venture Capital Trusts (VCTS) so far this tax year, but time is running out to take advantage of tax perks from them.
-
 ISA quiz: How much do you know about the tax wrapper?
Quiz One of the most efficient ways to keep your savings or investments free from tax is by putting them in an Individual Savings Account (ISA). How much do you know about ISAs?