Trading is not for the sentimental
Too many traders get emotionally attached when making trades. That's a mistake, says John C Burford. You need to develop an arm's length mindset to the markets. Here, he explains the techniques to use.
Get the latest financial news, insights and expert analysis from our award-winning MoneyWeek team, to help you understand what really matters when it comes to your finances.
You are now subscribed
Your newsletter sign-up was successful
Want to add more newsletters?

Twice daily
MoneyWeek
Get the latest financial news, insights and expert analysis from our award-winning MoneyWeek team, to help you understand what really matters when it comes to your finances.

Four times a week
Look After My Bills
Sign up to our free money-saving newsletter, filled with the latest news and expert advice to help you find the best tips and deals for managing your bills. Start saving today!
Just before I get to the Dow, I'll briefly follow up on Apple.
I've been covering Apple lately because it's a superb example of how to use my tramline methods to position into great trades both short and long.
When I last covered Apple on21 November (The Dow hits my target), I noted the market had made it down to my lowest tramline just above the $500 target:
MoneyWeek
Subscribe to MoneyWeek today and get your first six magazine issues absolutely FREE

Sign up to Money Morning
Don't miss the latest investment and personal finances news, market analysis, plus money-saving tips with our free twice-daily newsletter
Don't miss the latest investment and personal finances news, market analysis, plus money-saving tips with our free twice-daily newsletter
The low was made on the previous Friday and I expected the market to bounce up from there to reach for the underside of the centre tramline.
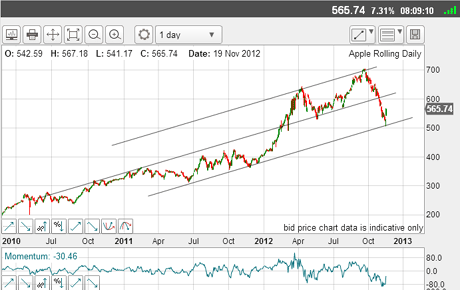
(Click on the chart for a larger version)
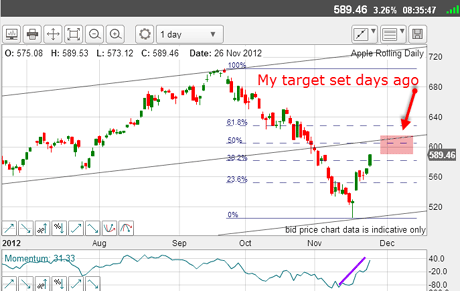
This is the latest situation in close-up:
(Click on the chart for a larger version)
Since then, momentum has swung from oversold to overbought in a week. How's that for volatility?
And now, we are within a few whiskers of hitting my target, which is the area where the Fibonacci 50% retrace and tramline cross.
Swing traders would be looking to take profits off the table for a magnificent campaign short near $680 and reverse near $500 and then exit near $600.
But that's not all there is another probable short trade coming up!
Note that all of these trades could have been made using the simple visual application of my tramline method. No black boxes, mathematical algorithms, or expensive software required.
Develop an arm's length mindset to markets
But to make it work, you need to have an arm's length' attitude to Apple and be able to go short as well as long. This is difficult for many because loyalty to the Apple brand is so strong. Steve Jobs was treated like a prophet, not an executive. Not too many CEOs of major corporations are so regarded.
Most people who follow Apple are buyers and don't short the stock. That set up the big selling panics we saw in October as the weaker hands abandoned ship.
In short, people think about this stock sentimentally.
I am immune to this mania, and I am probably at an advantage here. I was born into an era when an apple was a fruit to be scrumped. Electronic technology is merely a tool to enable me to do my work more efficiently.
Younger people can easily be seduced by the allure of tech and of the guru Steve Jobs. But there is a great deal of difference between the share price and the products not to mention the fact that those products can rapidly go out of fashion (may the Blackberry RIP).
The Dow rallies to the 13,100 area
Now to the Dow. Last Wednesday, I believed the market would rally back to the 13,000 area 250 points away. This was the picture then:
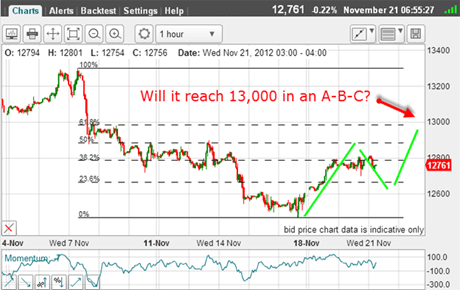
(Click on the chart for a larger version)
And this is the picture now:
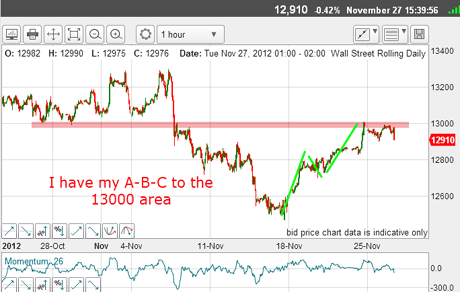
(Click on the chart for a larger version)
How nice! An excellent place to put on new shorts or add to existing positions. And I have my A-B-C (counter-trend) formation.
The question is: Is this the resumption of the downtrend or will the market dip down and then back up for a larger A-B-C, with the C wave above the 13,000 level?
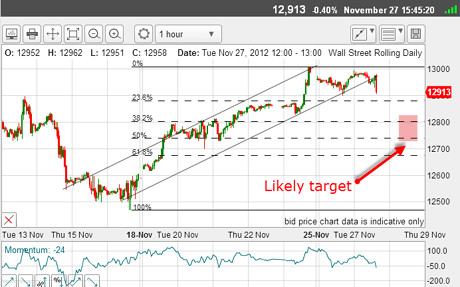
Let's zoom in now:
(Click on the chart for a larger version)
I have drawn my less-than-satisfactory tramlines, but they are the best I can do, given the market. Right away, the lower tramline has been broken which gives me a shorting signal. And I have the Fibonacci levels which will give me turning points.
As I write this morning, the market has broken beneath the 12,900 level, thereby giving me more confirmation of the turn down.
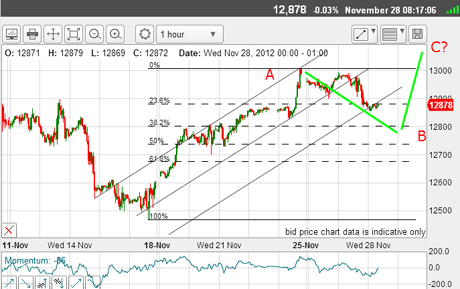
This is the current picture:
(Click on the chart for a larger version)
As I suspected, the 13,000 level is representing very stiff resistance, so the pull-back should be quite sharp.
With the tramline break, I can now draw in my third tramline below, which the market is already running alongside at the Fibonacci 23% level. A break lower for the Fibonacci 38% level would set up an interesting dilemma.
Trouble for stocks in the longer term
There is the real possibility that the bounce off the 38% or even 50% levels could set up another assault on the 13,000 level. In this case, we would get a large A-B-C, as shown with the C wave pushing above 13,000.
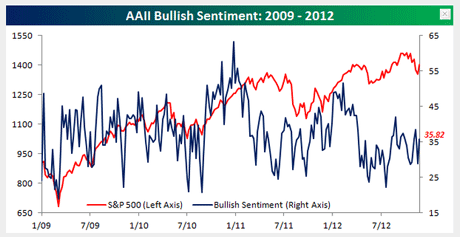
I have often given the American Association of Individual Investors (AAII) sentiment data in my Dow posts. Here is a handy chart of the AAII bullish sentiment since 2009 plotted against the S&P:
(Click on the chart for a larger version)
It is interesting that bullish sentiment peaks before a peak in stocks, so these bullish sentiment peaks give an advance warning of major market turns.
The other significant point from this chart is that the peaks in sentiment since January 2011 have been successively lower, while S&P peaks have trended higher. This is a major divergence. It spells trouble for stocks longer-term.
If you're a new reader, or need a reminder about some of the methods I refer to in my trades, then do have a look at my introductory videos:
The essentials of tramline trading
An introduction to Elliott wave theory
Advanced trading with Elliott waves
Don't miss my next trading insight. To receive all my spread betting blog posts by email, as soon as I've written them, just sign up here . If you have any queries regarding MoneyWeek Trader, please contact us here.
Get the latest financial news, insights and expert analysis from our award-winning MoneyWeek team, to help you understand what really matters when it comes to your finances.
John is is a British-born lapsed PhD physicist, who previously worked for Nasa on the Mars exploration team. He is a former commodity trading advisor with the US Commodities Futures Trading Commission, and worked in a boutique futures house in California in the 1980s.
He was a partner in one of the first futures newsletter advisory services, based in Washington DC, specialising in pork bellies and currencies. John is primarily a chart-reading trader, having cut his trading teeth in the days before PCs.
As well as his work in the financial world, he has launched, run and sold several 'real' businesses producing 'real' products.
-
 UK interest rates live: rates held at 3.75%
The Bank of England’s Monetary Policy Committee (MPC) met today to decide UK interest rates, and voted to hold rates at their current level
-
 MoneyWeek Talks: The funds to choose in 2026
Podcast Fidelity's Tom Stevenson reveals his top three funds for 2026 for your ISA or self-invested personal pension