The Shinzo Abe rocket is sputtering
Japanese stocks may be rising in the long term, says John C Burford. But that doesn't mean the market can't turn when you're not looking.
Get the latest financial news, insights and expert analysis from our award-winning MoneyWeek team, to help you understand what really matters when it comes to your finances.
You are now subscribed
Your newsletter sign-up was successful
Want to add more newsletters?

Twice daily
MoneyWeek
Get the latest financial news, insights and expert analysis from our award-winning MoneyWeek team, to help you understand what really matters when it comes to your finances.

Four times a week
Look After My Bills
Sign up to our free money-saving newsletter, filled with the latest news and expert advice to help you find the best tips and deals for managing your bills. Start saving today!
Japan is the latest country to renew its massive stimulus QE-type operation (dubbed 'Abenomics'), just as the US and the UK have ceased theirs. When the US Fed started its programme in 2008, stocks were the major beneficiary. From the depths of the 2009 lows at 6,500, the Dow has improved by over 160% to the recent 17,700 print.
And because the latest intended Japanese stimulus is reckoned to be about three times that of the Fed when adjusted for relative GDP figures, I am curious to see if the Nikkei will appreciate by at least 160% over the next few years. By logical extension, that would at least match the US performance.
Of course, I am being facetious. There is no way the Nikkei could rise from the current 17,500 level to the giddy heights of 45,500 or is there?
MoneyWeek
Subscribe to MoneyWeek today and get your first six magazine issues absolutely FREE

Sign up to Money Morning
Don't miss the latest investment and personal finances news, market analysis, plus money-saving tips with our free twice-daily newsletter
Don't miss the latest investment and personal finances news, market analysis, plus money-saving tips with our free twice-daily newsletter
Those of us of a certain age will recall the amazing times in the 1980s when a Dutch tulip-like speculative mania for Japanese real assets was erupting. At one time, the land under the Tokyo Imperial Palace was said to be worth more than the entire state of California!
And the Nikkei shot up to the 40,000 level
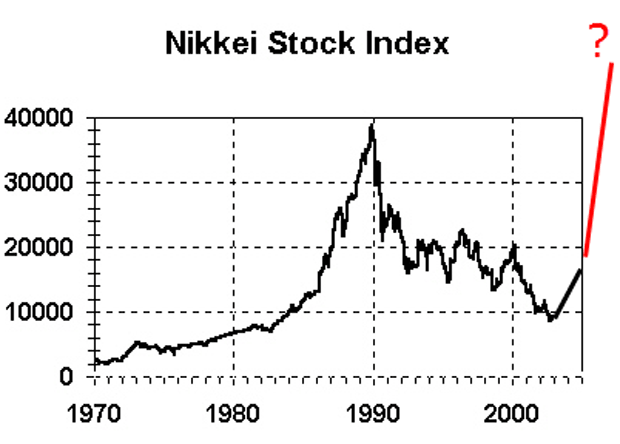
before the helium escaped, sending everything crashing.
So today, I want to look at what has been happening in the Nikkei since last Wednesday'spost.
The market challenges my tramline again
Back on planet earth, the market has my upper tramline to contend with before it shoots off towards 45,500.
Last Wednesday, I showed the daily chart where the market was challenging the upper tramline. Here it is updated:
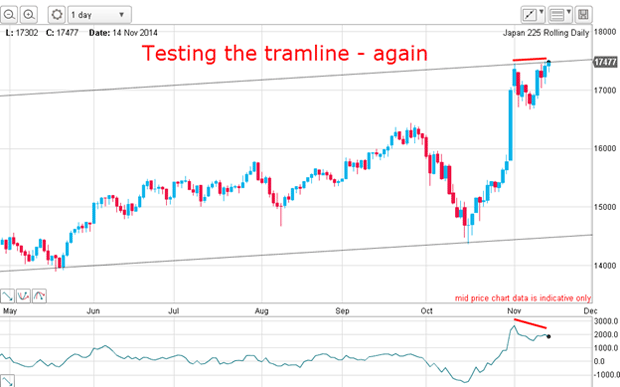
On Wednesday, I showed how to take an Elliott-wave-inspired 600-point profit on one day with the low-risk upside break of the recent dip. Here is the hourly chart updated to Friday's close:
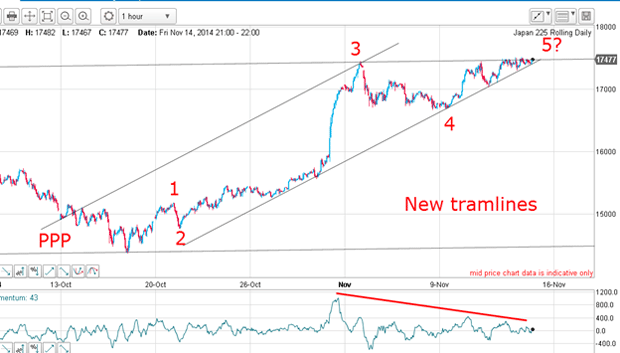
This is what I wrote on Friday in preparation for this post: the Nikkei is now clearly at a crossroads. The fifth wave could be ending here as the market slightly poked above the wave 3 high last week. Remember, last time I wrote: "And because the third wave is exceptionally long and strong, there is an enhanced risk the fifth wave could be shorter than normal."
Support is coming in from my lower tramline, which is highly reliable. That is because I have multiple accurate touch points with virtually no pigtails. This is a solid line of support and if it gives way, the aftermath should be notable.
Also, my upper tramline is as good as I can expect from the one major wave 3 touch point. There is a good PPP (prior pivot point) and one more touch point near it.
As of Friday, the battle was on between the resistance of my long-term tramline plus the turning power of a fifth wave and the strong lower tramline support.
Round one goes to the bears
Here is the chart updated to this morning showing the massive tramline break that occurred over the weekend:
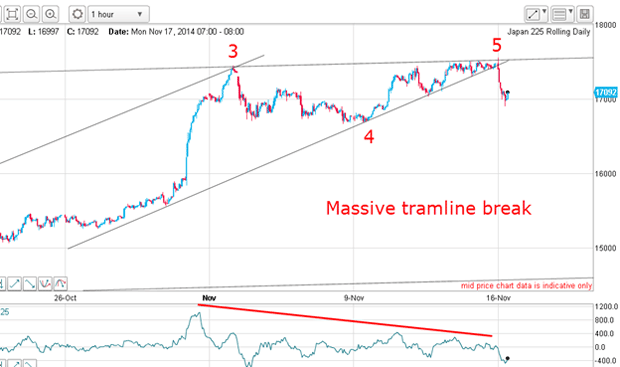
Round one to the bears!
The action over the weekend was significant. The market made another attempt at pushing above my long-term tramline, but was hit by heavy selling which broke my lower tramline. Here is a close-up:
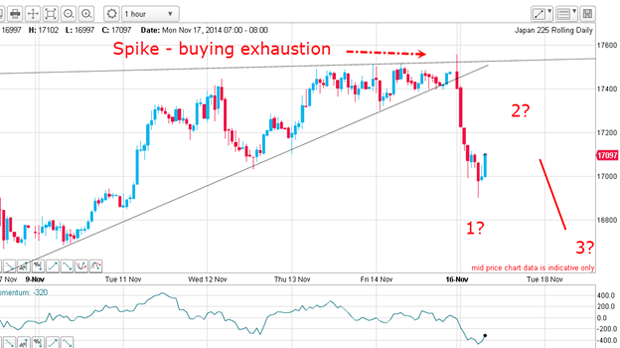
This reversal is a clear sign that buying power had exhausted (if you were awake at the time!) and the path of least resistance was now down. The last remaining protective buy stops placed by the few remaining bears were taken out and the market was free to fall.
Of course, the pattern at the top is a classic rising wedge where breakouts are usually to the downside, as here. This could have been anticipated last week, and to catch a likely break down an entry sell stop would have been entered just below the lower tramline. This would have captured the sharp decline overnight.
How to know that the market has reversed
To confirm the reversal, I would like to see a mini five-wave pattern down with a long and strong third wave. I have entered provisional wave labels on the above chart. An alternative labelling would place my wave 1 as wave 3 and the current rally as wave 4. A dip in wave 5 down would confirm this scenario. At this stage, it is just too early to have confidence in any of these scenarios.
But once I see my five waves, I can have much more confidence that the market has indeed reversed.
Recall I took a 600-pip profit on the wave 5 up to the high and was quick to take profits. That was because it is rarely a prudent policy to hang around too long in a fifth wave they are ending waves and can turn at any moment. And when the market does reverse, it can do so overnight while you are sleeping, as here.
As I write, the market has given up most of the gains since my long entry, causing me to be glad to have exited quickly. I rest my case.
Get the latest financial news, insights and expert analysis from our award-winning MoneyWeek team, to help you understand what really matters when it comes to your finances.
John is is a British-born lapsed PhD physicist, who previously worked for Nasa on the Mars exploration team. He is a former commodity trading advisor with the US Commodities Futures Trading Commission, and worked in a boutique futures house in California in the 1980s.
He was a partner in one of the first futures newsletter advisory services, based in Washington DC, specialising in pork bellies and currencies. John is primarily a chart-reading trader, having cut his trading teeth in the days before PCs.
As well as his work in the financial world, he has launched, run and sold several 'real' businesses producing 'real' products.
-
 Should you buy an active ETF?
ETFs are often mischaracterised as passive products, but they can be a convenient way to add active management to your portfolio
-
 Power up your pension before 5 April – easy ways to save before the tax year end
With the end of the tax year looming, pension savers currently have a window to review and maximise what’s going into their retirement funds – we look at how