The fog is lifting on the Dow
The picture in the Dow Jones is starting to clear, says spread betting expert John C Burford. We're looking at the start of a long decline.
Get the latest financial news, insights and expert analysis from our award-winning MoneyWeek team, to help you understand what really matters when it comes to your finances.
You are now subscribed
Your newsletter sign-up was successful
Want to add more newsletters?

Twice daily
MoneyWeek
Get the latest financial news, insights and expert analysis from our award-winning MoneyWeek team, to help you understand what really matters when it comes to your finances.

Four times a week
Look After My Bills
Sign up to our free money-saving newsletter, filled with the latest news and expert advice to help you find the best tips and deals for managing your bills. Start saving today!
On Monday, I outlined my dilemma in analysing the Dow charts where I had several competing options for the long-term Elliott wave counts. But the short-term picture is starting to clear.
My most bullish option calls for a new high above last year's all-time high at 18,365. That would complete a very large scale five up off the 2009 lows, and complete an even larger B wave rally. The A wave is the plunge to the 6,500 low in March 2009.
The implication is that when the B wave completes, the market will descend in the C wave to finish in the region of the B wave low, or below. And that is the prize awaiting patient traders who are looking for the top to ride the move down.
MoneyWeek
Subscribe to MoneyWeek today and get your first six magazine issues absolutely FREE

Sign up to Money Morning
Don't miss the latest investment and personal finances news, market analysis, plus money-saving tips with our free twice-daily newsletter
Don't miss the latest investment and personal finances news, market analysis, plus money-saving tips with our free twice-daily newsletter
C waves are third waves and often show typical third wave behaviour, including a long and strong character. When in them, we see many large daily drops with gaps commonly found. These third waves are unmistakable when in full flow.
We have had many false dawns in the past few years, and I have described how I have played the short side in these swoons in my emails.
But there is another option that could work; here it is on the weekly chart:
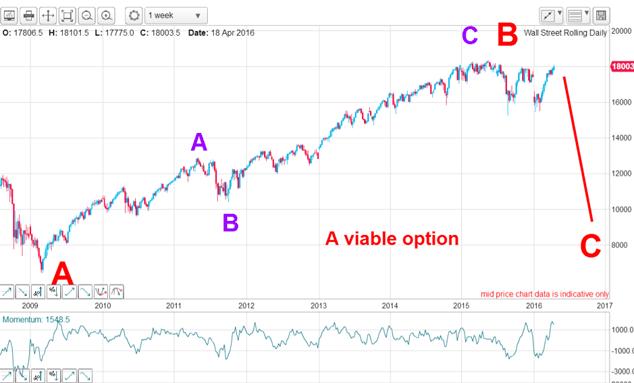
Red wave B is an A-B-C (purple) and not a five up. Where I had last year's May high as a third wave top, I can also consider it the purple C wave top (as well as the larger red B wave top). That is so because the 18,365 May high has not been exceeded, yet.
But to check on the viability of this scenario, I need to zoom in a little closer. Here is the daily chart off the May high:
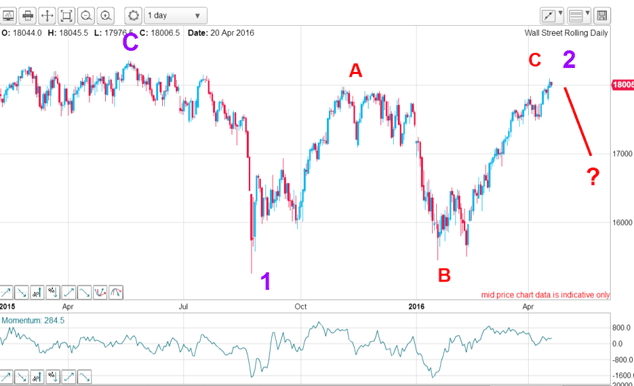
The August swoon is wave 1 of what should become a five wave decline. The rally off it is in the form of a typical A-B-C for purple wave 2. And yesterday, the market has poked above the A wave high to verify the A-B-C picture.
So the current level is a possible candidate for the market to make a turn down. But what would help to clinch it is a complete five impulse wave pattern within red wave C.
Here is wave C in close-up:
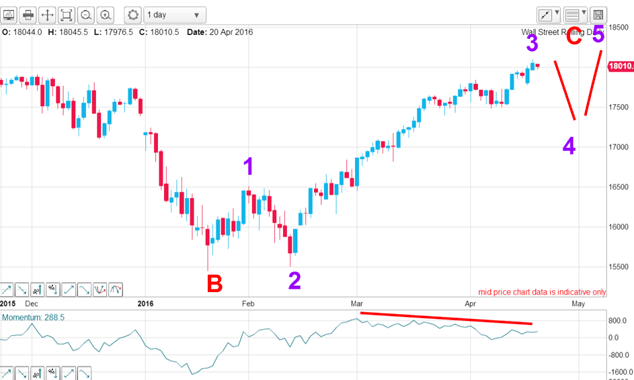
I can place these labels on wave C with waves 1 and 2 and now we are currently in wave 3, which should be finishing up prior to a decline in wave 4 and then a rally in wave 5. That should complete the red C wave and lead to a steeper decline.
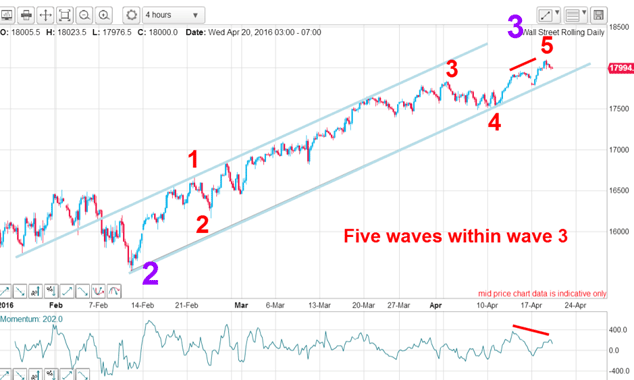
Are there any clues that the current rally will turn soon? I would need to see a complete five impulse waves within that purple wave 3 to make me interested.
Here is the four-hour chart of the third wave:
Trading in the short term would cause me to start looking for an exit on my long positions.
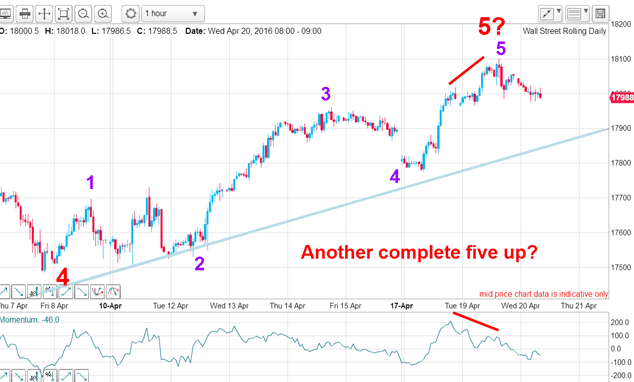
With yesterday's push above the 18,000 level, I have red wave 5 in progress. This satisfies the minimum requirement for me to forecast a turn down that could start at any time.
Also, I can draw in a super tramline pair where breaking the lower tramline would send me a strong signal.
But I have one more test I take the microscope and look inside the red wave 5 in the above chart:
And to demonstrate that markets are fractals (similar shaped waves within waves, as on the sea), here is the purple wave 5 in closeup:
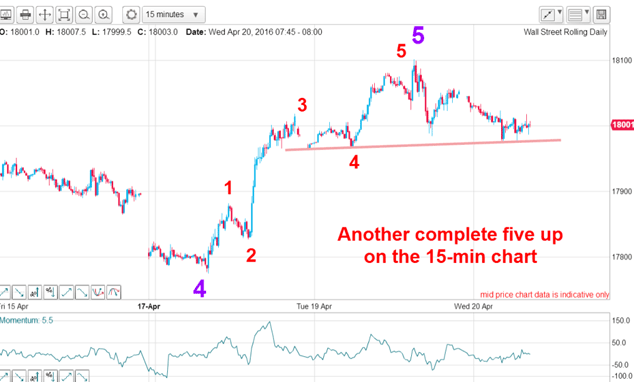
Even on the 15-minute chart, I have a complete five up, which makes complete fives up in three degrees of scale. Remember, all of this lies within the purple wave 3 of the third chart.
The bottom line is that under any viable scenario, the market is likely to be at or near the start of a decline which may stretch several hundreds of points at least, and that is why I decided to take some profits on my longs off the table.
Get the latest financial news, insights and expert analysis from our award-winning MoneyWeek team, to help you understand what really matters when it comes to your finances.
John is is a British-born lapsed PhD physicist, who previously worked for Nasa on the Mars exploration team. He is a former commodity trading advisor with the US Commodities Futures Trading Commission, and worked in a boutique futures house in California in the 1980s.
He was a partner in one of the first futures newsletter advisory services, based in Washington DC, specialising in pork bellies and currencies. John is primarily a chart-reading trader, having cut his trading teeth in the days before PCs.
As well as his work in the financial world, he has launched, run and sold several 'real' businesses producing 'real' products.
-
 MoneyWeek Talks: The funds to choose in 2026
Podcast Fidelity's Tom Stevenson reveals his top three funds for 2026 for your ISA or self-invested personal pension
-
 Three companies with deep economic moats to buy now
Opinion An economic moat can underpin a company's future returns. Here, Imran Sattar, portfolio manager at Edinburgh Investment Trust, selects three stocks to buy now