The fog clears in the Dow Jones charts
John C Burford uses Elliott wave theory to line up what promises to be a very profitable trade in the Dow.
Get the latest financial news, insights and expert analysis from our award-winning MoneyWeek team, to help you understand what really matters when it comes to your finances.
You are now subscribed
Your newsletter sign-up was successful
Want to add more newsletters?

Twice daily
MoneyWeek
Get the latest financial news, insights and expert analysis from our award-winning MoneyWeek team, to help you understand what really matters when it comes to your finances.

Four times a week
Look After My Bills
Sign up to our free money-saving newsletter, filled with the latest news and expert advice to help you find the best tips and deals for managing your bills. Start saving today!
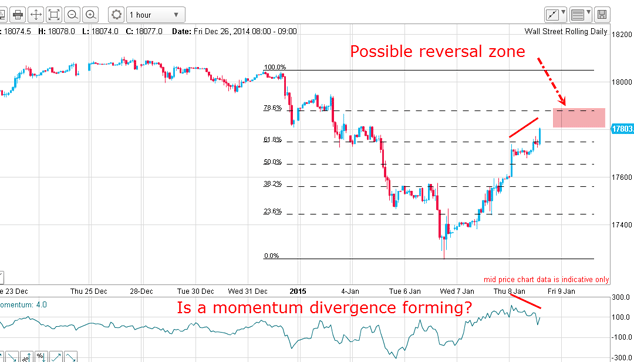
On Friday, I outlined my case for an immediate turn-down in the Dow (among many other stock indexes) based on my reading of the Elliott wave pattern and my use of the Fibonacci levels to pinpoint two very accurate reversals at the 78% level.
Today, I want to follow up on this story, because it highlights several important principles for traders, and will reinforce the lessons that the new members of the Trade for Profit Academy are learning.
This was the chart I left you with on Friday:
MoneyWeek
Subscribe to MoneyWeek today and get your first six magazine issues absolutely FREE

Sign up to Money Morning
Don't miss the latest investment and personal finances news, market analysis, plus money-saving tips with our free twice-daily newsletter
Don't miss the latest investment and personal finances news, market analysis, plus money-saving tips with our free twice-daily newsletter
Dow Jones 1 Jan 2015-9 Jan 2015

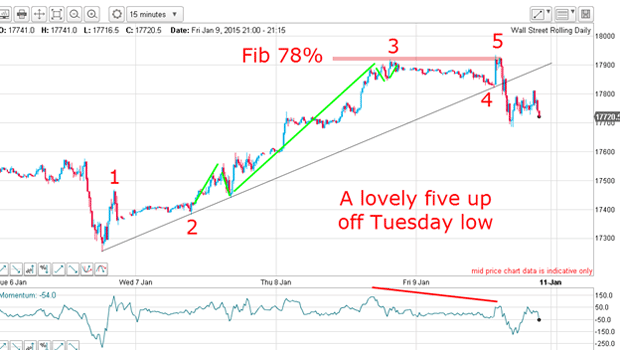
And this is how trading developed that day:

But the fog cleared as Friday's trading developed. What appeared as a succession of small over-lapping waves later that day turned out to be something much more defined and potentially very profitable. As trading developed throughout the day, the market spiked higher following the bullish' US jobs report issued at 1.30pm UK time.
But then, the market started retreating leaving a stand-out formation a complete five-wave motive pattern. And when the market broke below the wave 2wave 4 line, that was a clear sell signal. If you had that chart in front of you at 3pm and if you know my methods, you could not have failed to spot the opportunity.
Incidentally, media reports yesterday were universally bullish on that jobs number, but a funny thing happened on the way to new US growth-inspired stock highs. What was not mentioned in the hoopla was the steady drop in worker participation rate and the unusual drop in average hourly earnings. So what happened to the idea that wages/salaries are now on the rise and set to exceed the consumer price index? So much for a booming economy.
As you know, I never tire of pointing out the unwise policy of taking media commentary seriously. It is entertainment, pure and simple (or rather, it can be used as a contrary indicator). The reversal following the knee-jerk spike higher was very likely a classic buyer exhaustion event.
Of course, I then needed confirmation that the market wanted to move lower to conform with my Elliott wave labels and my bearish expectation. Naturally, if the market moved higher instead, I was ready to abandon my bearish scenario.
But crucially, the market's move during the remainder of Friday was to hold terrific confirmation to back up my prognosis.
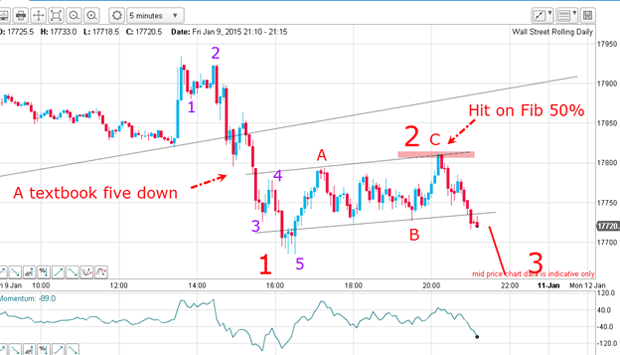
I will show this in the five-minute chart for added clarity of the waves:

The move down is a classic five down with long and strong wave 3 and the rally is a textbook corrective A-B-C with the C wave terminating at the precise hit on the Fibonacci 50% level.
It really doesn't get much better than this. The C wave high was an excellent place for a short trade at low risk. This whole pattern is a classic reversal signal.
The move down into the weak close has broken the small lower tramline and this sets up the probability that we have a small-scale wave 1 and 2 in place and have entered the wave 3 down.
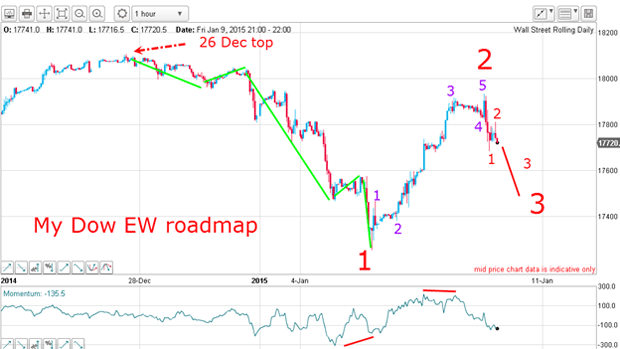
Now let's combine this chart with the hourly chart and put all of this together:

The move down off the 26 December high is in five motive waves and the relief rally is also in five waves with wave 5 terminating at the Fibonacci 78% level.
That sets up the larger-scale wave 1 down and wave 2 up. And on Friday, the move down off the wave 2 high is in five waves down to wave, the relief rally of wave 2 is an A-B-C with the C wave terminating at the Fibonacci 50% level.
If correct, we should be in two wave 3s and we know what the implications are. Wave three of three is one of the most powerful patterns in the book and also one of my favourites to trade.
Of course, any trade could go wrong and you should always use stop-loss orders.
The lesson here: getting to grips with the basic ideas of Elliott wave theory can put you in the driver's seat and that is what members of my Trade for Profit Academy are now busy doing.
Get the latest financial news, insights and expert analysis from our award-winning MoneyWeek team, to help you understand what really matters when it comes to your finances.
John is is a British-born lapsed PhD physicist, who previously worked for Nasa on the Mars exploration team. He is a former commodity trading advisor with the US Commodities Futures Trading Commission, and worked in a boutique futures house in California in the 1980s.
He was a partner in one of the first futures newsletter advisory services, based in Washington DC, specialising in pork bellies and currencies. John is primarily a chart-reading trader, having cut his trading teeth in the days before PCs.
As well as his work in the financial world, he has launched, run and sold several 'real' businesses producing 'real' products.
-
 Japanese stocks rise on Takaichi’s snap election landslide
Japan’s new prime minister Sanae Takaichi has won a landslide victory in a snap election, prompting optimism that her pro-growth agenda will benefit Japanese stocks
-
 Alphabet 'is planning a 100-year bond': would you back Google for 100 years?
Google owner Alphabet is reported to be joining the rare century bond club