Watch out – the euro is headed lower
A 'kiss' in the charts is indicating a decline in the euro against the dollar. John C Burford hunts for other clues to help firm up his forecast.
Get the latest financial news, insights and expert analysis from our award-winning MoneyWeek team, to help you understand what really matters when it comes to your finances.
You are now subscribed
Your newsletter sign-up was successful
Want to add more newsletters?

Twice daily
MoneyWeek
Get the latest financial news, insights and expert analysis from our award-winning MoneyWeek team, to help you understand what really matters when it comes to your finances.

Four times a week
Look After My Bills
Sign up to our free money-saving newsletter, filled with the latest news and expert advice to help you find the best tips and deals for managing your bills. Start saving today!
As a change of pace from the very volatile Dow, I will cover the EUR/USD today. It is showing some excellent and accurate Fibonacciretraces as well as a terrific new tramlinepair.
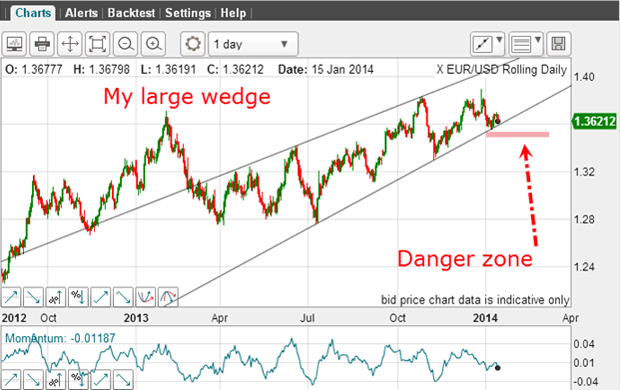
On 3 February,I showed the large wedge pattern:

I noted that if the market could drop into the danger zone and break the lower wedge line, it would probably indicate a downtrend. In the interim, the market did indeed trade down to this zone. But then it staged a rally.
MoneyWeek
Subscribe to MoneyWeek today and get your first six magazine issues absolutely FREE

Sign up to Money Morning
Don't miss the latest investment and personal finances news, market analysis, plus money-saving tips with our free twice-daily newsletter
Don't miss the latest investment and personal finances news, market analysis, plus money-saving tips with our free twice-daily newsletter
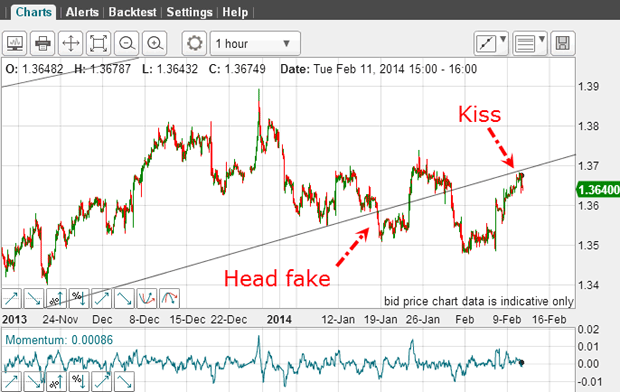
Here is the hourly chart showing a close-up of the recent action:

The rally only carried to the underside of the tramline in a kiss. As I write, the market is peeling away from this kiss. The normal action following a kiss is a scalded cat bounce' a sharp move away from the wedge line.
So this is setting up the probability that the decline will resume. But are there any other clues that can help firm up my forecast?
Finding the 'Chinese hat'
second high
And this is the result:

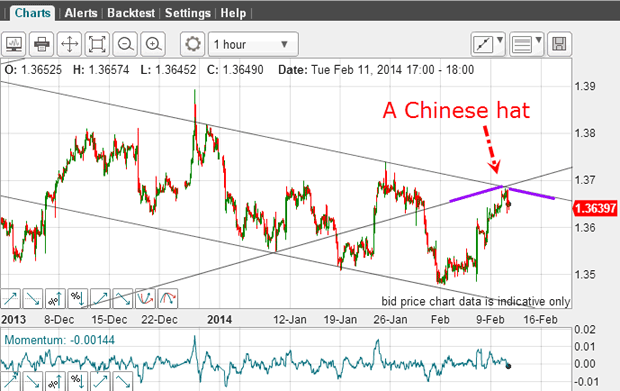
I have three accurate touch points on the upper line, which is satisfactory. The lower line is a little problematic and I could have placed it slightly higher with just as good a result. But it is the upper line that is in play.
Now I have an area where two tramlines from different time-frames meet in a crossover. This area where my upper tramline crosses the up-sloping wedge line is very important. It's an area of very high resistance, since both lines represent strong resistance. I call this crossover a Chinese hat' for obvious reasons.
This pattern reinforces my idea that the market should now trend lower. But is there any other clue that can shine more light on this question?
Will the market trend lower?

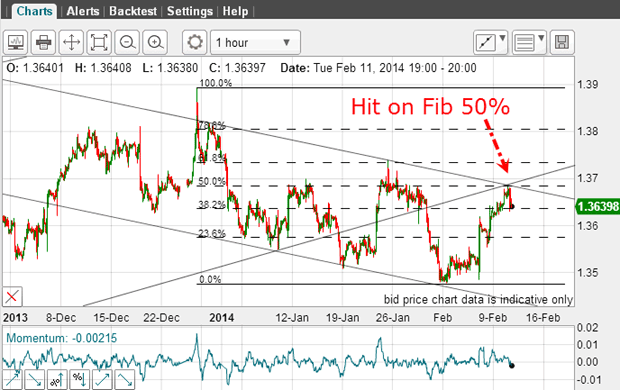
I have drawn in the Fibonacci retrace levels of the wave down from the 1.39 high and the recent low. And the market has just hit the Fibonacci 50% level on the nose. I am using the spike high (which I ignored when drawing my tramlines) because I always start with the most recent significant high and low as pivot points.
The 50% level is a common area for a reversal if the rally up is a counter-trend move.
Putting all of these clues together I have this scenario:
A recent kiss on the wedge line, indicating a down move
A reversal at a Chinese hat (strong resistance) on the tramlines
A Fibonacci 50% retrace of a strong down move from the 1.39 high
This is a strong case for the market to trend lower.
And the move up to the 50% level was the area to take the trade at low risk. Your protective stop could be placed just above the high. The confluence of the three resistancelevels at 1.3680 gave a pin-point entry level for a trade. This provides an excellent example of how you could have managed the trade.
This is no place for ego
One trade should not determine your long-term success. Having too much emotional stake in being right' on a market is a hindrance to your performance. So be even-handed in your trades. Some beautifully-researched trades will go wrong. That is a fact of life. And some will go spectacularly right. But don't let them go to your head. There is no place for ego in the trading arena!
On Monday, I asked you a question. I had a long Dow trade working and it had reached an important Fibonacci retrace level. How should I handle this profitable trade? I shall discuss this on Friday because it goes to the heart of the management of your trades. It's an aspect of trading that mostly determines your long-term performance. After all, it's often said that the easiest part of trading is entering a trade, and the hardest part is exiting it.
Get the latest financial news, insights and expert analysis from our award-winning MoneyWeek team, to help you understand what really matters when it comes to your finances.
John is is a British-born lapsed PhD physicist, who previously worked for Nasa on the Mars exploration team. He is a former commodity trading advisor with the US Commodities Futures Trading Commission, and worked in a boutique futures house in California in the 1980s.
He was a partner in one of the first futures newsletter advisory services, based in Washington DC, specialising in pork bellies and currencies. John is primarily a chart-reading trader, having cut his trading teeth in the days before PCs.
As well as his work in the financial world, he has launched, run and sold several 'real' businesses producing 'real' products.
-
 ISA fund and trust picks for every type of investor – which could work for you?
Whether you’re an ISA investor seeking reliable returns, looking to add a bit more risk to your portfolio or are new to investing, MoneyWeek asked the experts for funds and investment trusts you could consider in 2026
-
 The most popular fund sectors of 2025 as investor outflows continue
It was another difficult year for fund inflows but there are signs that investors are returning to the financial markets