Many traders ask me what my top markets to trade are. That's easy to answer. They are the Dow, EUR/USD and gold.
Gold is the slightly odd one out, because it is often treacherous and spiky. The Dow and the euro, on the other hand, trade with very few of these qualities. But the potential rewards in gold trading make it worthwhile - as long as risk is under control.
I wrote about gold last Wednesday. Today, I will cover the euro because it's showing signs of breaking down. I suggested this would happen in my post of 15 January.
Try 6 free issues of MoneyWeek today
Get unparalleled financial insight, analysis and expert opinion you can profit from.

Sign up to Money Morning
Don't miss the latest investment and personal finances news, market analysis, plus money-saving tips with our free twice-daily newsletter
Don't miss the latest investment and personal finances news, market analysis, plus money-saving tips with our free twice-daily newsletter
That was when I noted the five waves down on the hourly chart which I had forecast. The market then bounced off the five wave low which was also at the third tramline support. This was the chart then:

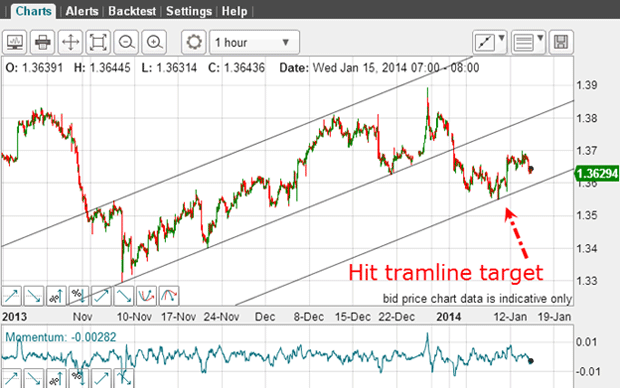
My question was: is the uptrend resuming or is this the start of a new downtrend? The five waves down hinted that the trend was now down. But I needed more confirmation such as a break of the third tramline.
Since then, the market did go on to break below this tramline. But then a strange thing happened. It reversed course and rallied back up through the line:

This is what I call a head fake and because it is one of the trickiest features in tramline trading, I will outline how I handle them.
How to handle a head fake
The market made a deep penetration inside the trading channel, but could not hold these gains. It then fell back and broke below the tramline for the second time. That was my clue that the market really wanted to decline. And another short trade was indicated with entry just below the tramline.
As it turned out, this was successful because my protective stop again, placed just above the tramline inside the trading channel was safe.
The market dropped sharply last week and is currently 200 pips below entry.
How did I handle the head fake? By staying with my trade until it stopped out. I then watched for signs which way the market wanted to go (and this takes a little patience!). And I acted on the second clear tramline break.
Is it time to abandon my tramlines?
Last time, I showed the terrific wedge pattern on the daily chart:
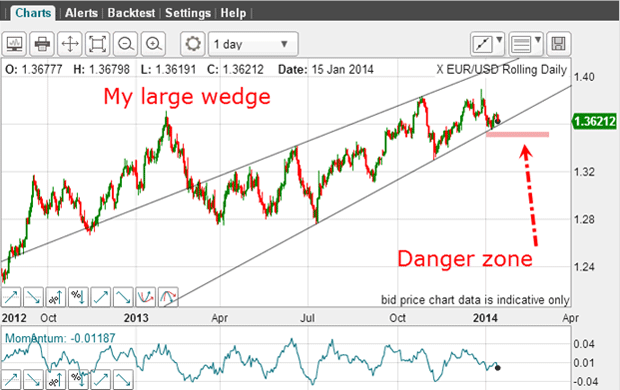
The market was flirting with the lower line at the 1.36 level. And my view was that if the market could break this line and trade down to the danger zone, the new downtrend would be all but assured.

This morning the market has declined into the zone. The trend is now down. This sets up an interesting Elliott-wave forecast:

The move down to my new wave 1 is in five clear waves, as I showed last time.Remember, a five wave pattern off a major high indicates the trend has changed. That is one of the clear trading rules of EWT (Elliot-wave theory).
The surprise' rally is wave 2. And now with the break of the wave 1 low, we should be in at the start of a large wave 3. If this is correct, this wave 3 should carry the market down in a long and strong move.
There is another view (there always is!). Alternatively, the current move is wave C of an A-B-C pattern off the 1.39 top. This view is almost as valid as my wave 3 idea. I'll know soon which will prevail, since third waves are highly trending.
Taking money from the hedge funds
| (Contracts of EUR 125,000) | Row 0 - Cell 1 | Row 0 - Cell 2 | Row 0 - Cell 3 | Open interest: 260,799 | ||||
| Commitments | ||||||||
| 86,963 | 72,616 | 6,663 | 126,816 | 118,340 | 220,442 | 197,619 | 40,357 | 63,180 |
| Changes from 01/21/14 (Change in open interest: 5,499) | ||||||||
| 7,642 | -10,477 | 498 | -4,257 | 22,328 | 3,883 | 12,349 | 1,616 | -6,850 |
| Percent of open in terest for each category of traders | ||||||||
| 33.3 | 27.8 | 2.6 | 48.6 | 45.4 | 84.5 | 75.8 | 15.5 | 24.2 |
| Number of traders in each category (Total traders: 182) | ||||||||
| 44 | 64 | 23 | 46 | 49 | 103 | 123 | Row 8 - Cell 7 | Row 8 - Cell 8 |
I believe it does! In the past week, both groups of specs have swung heavily to the bullish camp. The commercials (the smart money') have taken to the bearish side. The data is valid as of last Tuesday right at the wave 2 high!
Since then, the market has dropped by 200 pips, thus trapping the bulls into losing positions. I like that. It reveals that, at turning points, both large and small specs can get it spectacularly wrong. Their unwinding of positions provides the fuel for the adverse move.
Nimble traders can take full advantage of this by taking money from the hedge funds. As you know, this is a favourite sport of mine. And all that was needed was an application of my simple trading rules.