The euro is trading beautifully against the dollar
Right on cue, the euro is following John C Burford's analysis of the charts to the letter. So, where is the single currency heading to next?
Get the latest financial news, insights and expert analysis from our award-winning MoneyWeek team, to help you understand what really matters when it comes to your finances.
You are now subscribed
Your newsletter sign-up was successful
Want to add more newsletters?

Twice daily
MoneyWeek
Get the latest financial news, insights and expert analysis from our award-winning MoneyWeek team, to help you understand what really matters when it comes to your finances.

Four times a week
Look After My Bills
Sign up to our free money-saving newsletter, filled with the latest news and expert advice to help you find the best tips and deals for managing your bills. Start saving today!
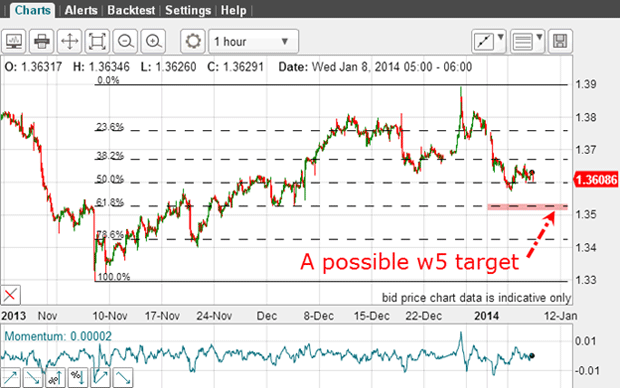
On 8 January, I was tracking the progress of the EUR/USD. I forecast the downward move as a five-wave pattern. This was the chart:

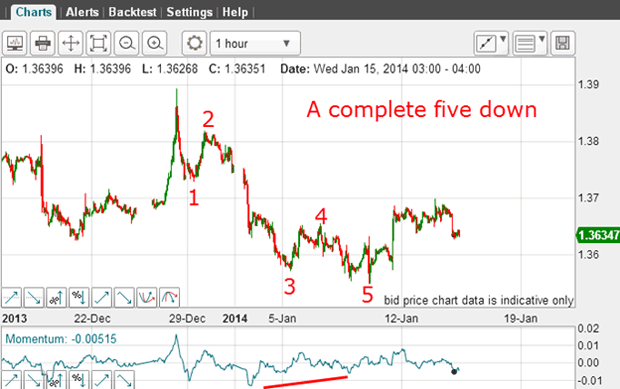
So far, the move off the 1.39 spike high is in four waves. What I was looking for was a final fifth wave down to terminate close to 1.35 at the Fibonacci 62% level. Let's see how this has played out:

I did get my fifth wave. In a textbook move, it carried to the 1.3550 area and on a large positive-momentum divergence (red bar). But it didn't quite carry to the Fibonacci 62% level. Since that does happen, we must be alert to these near-misses.
MoneyWeek
Subscribe to MoneyWeek today and get your first six magazine issues absolutely FREE

Sign up to Money Morning
Don't miss the latest investment and personal finances news, market analysis, plus money-saving tips with our free twice-daily newsletter
Don't miss the latest investment and personal finances news, market analysis, plus money-saving tips with our free twice-daily newsletter
Knowing when to exit
If you religiously stick with your exact Fibonacci level as your exit, you may see the market just fail to hit it. The market then moves against you and takes away your hard-earned profit. Don't let that happen to you!
Could this be a major move up?
Let's back up a little and see where the market is positioned in the larger picture:

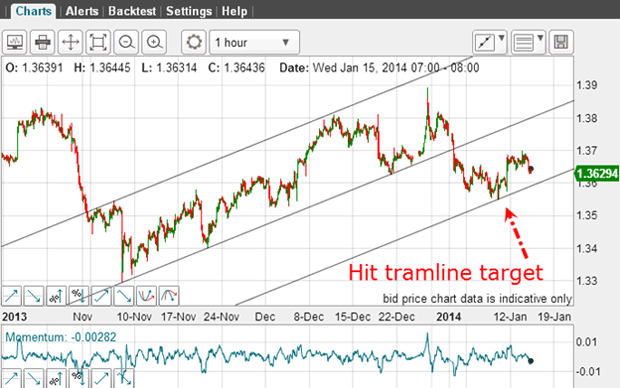
The upper tramline pair is the one I showed last time. And with the tramline break, I could draw in my third (lowest) tramline equidistant. This tramline now offers a short-term price target. And lo and behold, the market dropped to the new tramline and turned back up from that support line. Isn't that pretty?
A short trade taken at the tramline break and exited near the lowest tramline would have produced a gain of 100-150 pips.
No-man's land
The alternative is for the market to test the lower tramline and eventually break below it. Remember, the current rally is totally expected after the five waves down. Although it can be viewed as a three-wave affair, it is not a totally convincing A-B-C.
It's time to back up even more and look at the bigger picture:

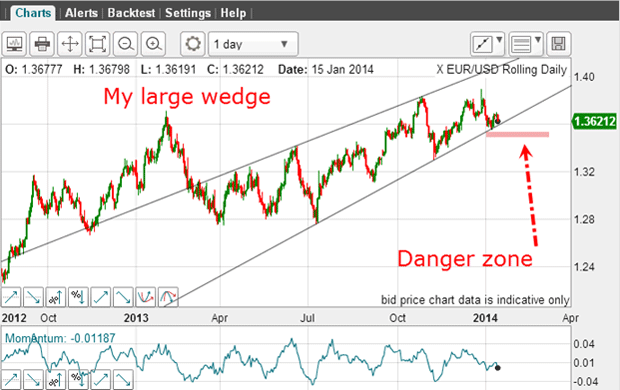
Here is my large wedge pattern where the trend lines are converging and the market is very close to the lower line. When markets move out of their wedge, they often move very swiftly, which places the area just under the lower line as my danger zone (for the bulls).
And with the clear five waves down just completed on the hourly chart, the main trend is very likely down.
Get the latest financial news, insights and expert analysis from our award-winning MoneyWeek team, to help you understand what really matters when it comes to your finances.
John is is a British-born lapsed PhD physicist, who previously worked for Nasa on the Mars exploration team. He is a former commodity trading advisor with the US Commodities Futures Trading Commission, and worked in a boutique futures house in California in the 1980s.
He was a partner in one of the first futures newsletter advisory services, based in Washington DC, specialising in pork bellies and currencies. John is primarily a chart-reading trader, having cut his trading teeth in the days before PCs.
As well as his work in the financial world, he has launched, run and sold several 'real' businesses producing 'real' products.
-
 Average UK house price reaches £300,000 for first time, Halifax says
While the average house price has topped £300k, regional disparities still remain, Halifax finds.
-
 Barings Emerging Europe trust bounces back from Russia woes
Barings Emerging Europe trust has added the Middle East and Africa to its mandate, delivering a strong recovery, says Max King