The Dow meets support on tramline
The Dow has pulled off a surprise rally. But with a strong line of resistance blocking its path, can the market break through? John C Burford examines the charts.
Get the latest financial news, insights and expert analysis from our award-winning MoneyWeek team, to help you understand what really matters when it comes to your finances.
You are now subscribed
Your newsletter sign-up was successful
Want to add more newsletters?

Twice daily
MoneyWeek
Get the latest financial news, insights and expert analysis from our award-winning MoneyWeek team, to help you understand what really matters when it comes to your finances.

Four times a week
Look After My Bills
Sign up to our free money-saving newsletter, filled with the latest news and expert advice to help you find the best tips and deals for managing your bills. Start saving today!
It's Halloween and the markets are getting downright spooky.
Yesterday I read that a very prominent and large London hedge fund was shutting up shop because "the founder feels he has no edge in the current markets".Translation: "I have lost money and investors are getting nervous".I believe this is happening across the industry.
If an experienced market operator believes the current markets are too tough, what chance do we mere mortals have?
MoneyWeek
Subscribe to MoneyWeek today and get your first six magazine issues absolutely FREE

Sign up to Money Morning
Don't miss the latest investment and personal finances news, market analysis, plus money-saving tips with our free twice-daily newsletter
Don't miss the latest investment and personal finances news, market analysis, plus money-saving tips with our free twice-daily newsletter
Let's see.
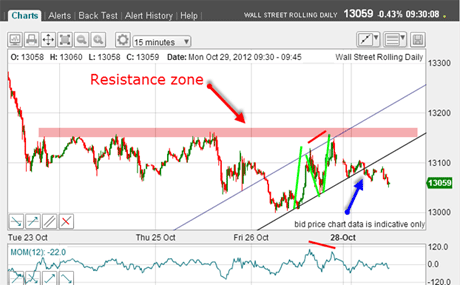
On Monday, I pointed out that the market had dropped down to major support at the critical round-figure 13,000 area.Having broken my short-term tramline, it appeared the market was heading below 13,000 my path of least resistance.
This was the chart on Monday:

(Click on the chart for a larger version)
All my indicators were in place for a resumption of the decline, as I outlined.
So, even with the disruption caused by Hurricane Sandy, did we see this decline?

(Click on the chart for a larger version)
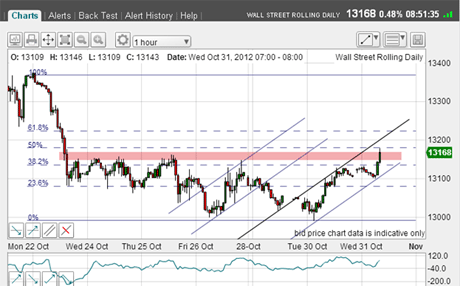
We certainly did see another 13,000 print yesterday, but just look at what occurred when the market fell to my fourth tramline support!
It staged a vigorous rally, albeit on low volumes and is trading up within the channel of the third and fourth tramlines.
Not only that, but it is eating away at the pink zone of resistance. Hmm.
Mr Market calls the shots!
All of this goes to show that even when you have strong clues as to market direction, it is Mr Market that is in control and if you are on the wrong side, it can give you quite a fright (on Halloween).
My short-sale trade in the 13,075 area has now been stopped for a loss of 75 pips. But I still have my original half position working with a stop at break-even, of course.That was a loss I was willing to accept.
So what is the outlook this morning?
Time to look at the Fibonacci levels.
I have drawn the levels using as high pivot point the most recent significant high at 13,370 on 22 October, and the low pivot point is the 13,000 low.
Remember, this is the Fibonacci set that I like to see first.
There is a crossing of the 50% level and the underside of the third tramline in the 13,200 region.This should be a barrier to further advances.
Using Fibonacci to find resistance levels
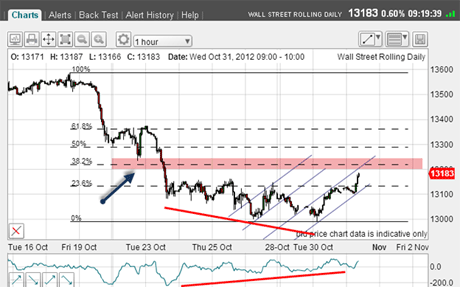
But hold on, what about the major Fibonacci set using the major high at 13,660 top on 18 October?After all, this also should be significant for finding resistance levels.

(Click on the chart for a larger version)
This is a very instructive chart.First, we have the positive momentum divergence as the market backed and filled under the 13,150 level - indicating a probable rally ahead.Then the bounce off my tramline, and finally, the Fibonacci 38% level lies in close proximity to the previous 50% level at the 13,200 area.
This is significant.In a recent post, I showed the very same confluence between different levels in a chart.
And in addition, we have chart resistance provided by the low of 22 October (blue arrow).
The evidence is piling up that there is major resistance in the 13,200 area.
Finally, the rally off yesterday's 13,000 print takes the form of an A-B-C so far.
According to my tramline rules, I will be looking to short the market again if the market approaches my third tramline especially if I see a negative momentum divergence on the hourly chart.
Meanwhile, I still have my original half short position working from the 13,490 area using my split bet' strategy (see Monday's post for an explanation of split betting).
Of course, the market may decide to take off to the upside, but with the considerable headwind of generally disappointing company earnings, the looming fiscal cliff', and declining retail investor confidence in the markets, this appears to be a longer shot.
And with the Fed having shot its last bullet with the promise of unlimited QE liquidity, can there be any more stimulus surprises from that quarter to provide a market boost?
If you're a new reader, or need a reminder about some of the methods I refer to in my trades, then do have a look at my introductory videos:
The essentials of tramline trading
An introduction to Elliott wave theory
Advanced trading with Elliott waves
Don't miss my next trading insight. To receive all my spread betting blog posts by email, as soon as I've written them, just sign up here . If you have any queries regarding MoneyWeek Trader, please contact us here.
Get the latest financial news, insights and expert analysis from our award-winning MoneyWeek team, to help you understand what really matters when it comes to your finances.
John is is a British-born lapsed PhD physicist, who previously worked for Nasa on the Mars exploration team. He is a former commodity trading advisor with the US Commodities Futures Trading Commission, and worked in a boutique futures house in California in the 1980s.
He was a partner in one of the first futures newsletter advisory services, based in Washington DC, specialising in pork bellies and currencies. John is primarily a chart-reading trader, having cut his trading teeth in the days before PCs.
As well as his work in the financial world, he has launched, run and sold several 'real' businesses producing 'real' products.
-
 Ayatollah Ali Khamenei: Iran’s underestimated chief cleric
Ayatollah Ali Khamenei is the Iranian regime’s great survivor portraying himself as a humble religious man while presiding over an international business empire
-
 'AI will change our world in more ways than we can imagine'
Interview Rob Arnott of Research Affiliates talks to Andrew Van Sickle about the AI bubble, the impact of tariffs on inflation and the outlook for gold and China