The Dow hits a brick wall at 12,950
The rally in the Dow Jones has hit a brick wall, and now the index looks to be in freefall territory. John C Burford looks at how to play it.
Get the latest financial news, insights and expert analysis from our award-winning MoneyWeek team, to help you understand what really matters when it comes to your finances.
You are now subscribed
Your newsletter sign-up was successful
Want to add more newsletters?

Twice daily
MoneyWeek
Get the latest financial news, insights and expert analysis from our award-winning MoneyWeek team, to help you understand what really matters when it comes to your finances.

Four times a week
Look After My Bills
Sign up to our free money-saving newsletter, filled with the latest news and expert advice to help you find the best tips and deals for managing your bills. Start saving today!
Well, that didn't take long, did it?
When I wrote yesterday, the Dow was knocking on new rally highs at around 12,940.
I showed the impressive five-wave Elliott wave pattern that strongly indicated to me that the top was nigh. I said more patience for the bears was required.
MoneyWeek
Subscribe to MoneyWeek today and get your first six magazine issues absolutely FREE

Sign up to Money Morning
Don't miss the latest investment and personal finances news, market analysis, plus money-saving tips with our free twice-daily newsletter
Don't miss the latest investment and personal finances news, market analysis, plus money-saving tips with our free twice-daily newsletter
But things are moving quickly on the Dow! After writing that in the early morning, the market pushed up, as high as 12,950.
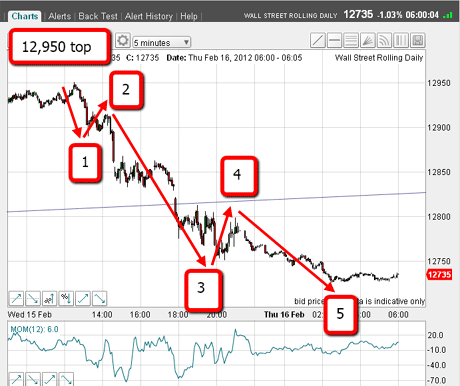
But then... the ground gave way. The market slumped to this morning's 12,730 print a decline of 220 pips in just a few hours.
The Dow could be in freefall territory'
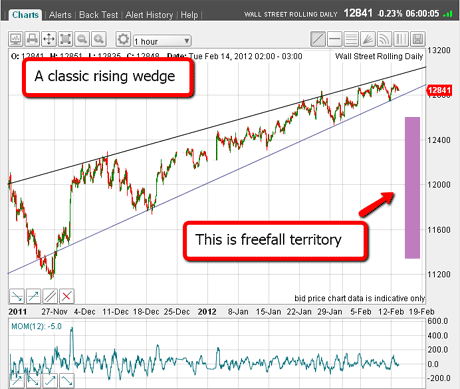
It appears we are now in freefall territory'. I showed you on this chart on Tuesday:

(Click on the chart for a larger version)
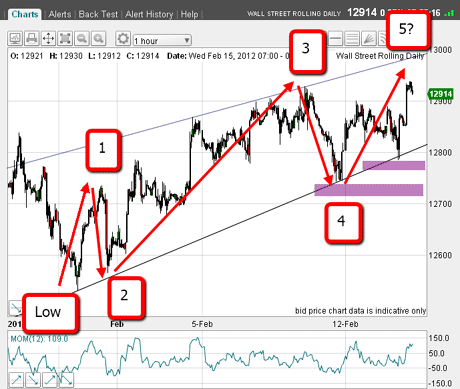
In the process of yesterday's collapse, the market broke not only the lower rising wedge trendline. It also broke the chart support levels, shownyesterday with my usual purple bars.
Here's that chart again:

(Click on the chart for a larger version)
And that is not all the decline off 12,950 has occurred in a clear minor five-wave Elliott wave pattern.
That is yet another giveaway to me that the top is now in.
I now have the ideal setup for further major declines. Look at this:

(Click on the chart for a larger version)
I have shown just one of several possible label placements. The fifth wave is extended and should end soon in a counter-trend rally.
Why I'm looking to sell Dow rallies
But many would say that this dip is a normal correction in a bull market. They'd say that I should be buying the dips as most 'experts' are saying the rally is just getting started.
That, certainly, has been the correct strategy for several months now. But I believe the game has radically changed and for the technical reasons I have been citing over the past few weeks.
If I'm right, selling rallies will now be the winning strategy.
As the market has been staging its impressive rally, the background economic picture has been less than impressive, despite attempts to talk it up.
And despite record amounts of stimulus', our economies have only managed a 'dead cat bounce' off the 2008 crash lows, while the forces of deflation have been grinding away.
For instance, the dramatic Greek situation involves writing down debt (the haircut') and austerity (less money) for the people. Both are highly deflationary. And they are only the first in this process.
Also, this week's GDP data from the eurozone was weak, but was hailed as 'better than expected'.What a vivid example of the truth of the maxim 'markets make opinions'. After a long bull run, all data is viewed as 'good'.In a bear market, this data would have been seen as 'bad'.
Savvy traders step outside this conventional way of thinking and take advantage of it by trading against the herd, which always gets crushed at major turns.
Another important point markets do not follow the economy, but lead it. This is a crucial point to grasp and when you do, it can help steer you away from making disastrous investment decisions at just the wrong time.
Psychological signs that we are in a bear market
One further point about market psychology how can I be confident we are in a bear market?
One of the most striking features of a bear market is that groups of all sizes from nations to local cricket clubs tend to polarise and even split up as fear and anger take over the human heart. We are seeing it in the eurozone, in the UK (Scotland independence is a real issue), and in the large multi-national banks.
During the bull market, none of this existed in fact, groups tended to coalesce and form even bigger unions (the eurozone is a classic example).
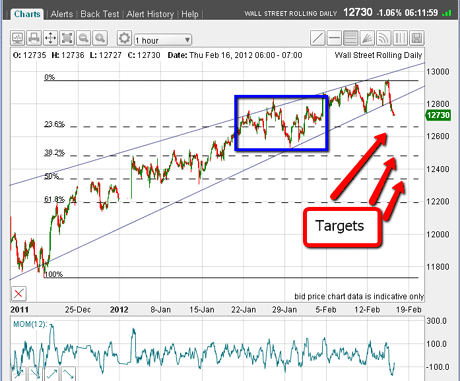
OK, so where are we in the bigger picture? Here is my wedge again as of this morning:

(Click on the chart for a larger version)
Three possible targets for the coming Dow collapse
I have drawn in the Fibonacci retracements of the entire rally off the October low. My targets are at or around these Fibonacci levels.
I had another long-standing target at 12,660 and the market is only 70 pips away from that.
Note the area outlined by the blue box. This is a zone of significant congestion on the way up and should provide stiff support on the way down.
Thus, I expect some good-sized rallies as the market enters this area. But they should be short-lived, and traders need to be nimble to jump on board.
Hopefully, I will see these counter-trend rallies in the form of an A-B-C pattern. That would confirm that the bear market has really got back on track.
If my analysis is correct, we should see a complete retracement of the wedge in a much shorter time than it took to build. The ride should be thrilling!
If you're a new reader, or need a reminder about some of the methods I refer to in my trades, then do have a look at my introductory videos:
The essentials of tramline trading
An introduction to Elliott wave theory
Advanced trading with Elliott waves
Don't miss my next trading insight. To receive all my spread betting blog posts by email, as soon as I've written them, just sign up here .
Get the latest financial news, insights and expert analysis from our award-winning MoneyWeek team, to help you understand what really matters when it comes to your finances.
John is is a British-born lapsed PhD physicist, who previously worked for Nasa on the Mars exploration team. He is a former commodity trading advisor with the US Commodities Futures Trading Commission, and worked in a boutique futures house in California in the 1980s.
He was a partner in one of the first futures newsletter advisory services, based in Washington DC, specialising in pork bellies and currencies. John is primarily a chart-reading trader, having cut his trading teeth in the days before PCs.
As well as his work in the financial world, he has launched, run and sold several 'real' businesses producing 'real' products.
-
 MoneyWeek Talks: The funds to choose in 2026
Podcast Fidelity's Tom Stevenson reveals his top three funds for 2026 for your ISA or self-invested personal pension
-
 Three companies with deep economic moats to buy now
Opinion An economic moat can underpin a company's future returns. Here, Imran Sattar, portfolio manager at Edinburgh Investment Trust, selects three stocks to buy now