You are now subscribed
Your newsletter sign-up was successful
Want to add more newsletters?

Twice daily
MoneyWeek
Get the latest financial news, insights and expert analysis from our award-winning MoneyWeek team, to help you understand what really matters when it comes to your finances.

Four times a week
Look After My Bills
Sign up to our free money-saving newsletter, filled with the latest news and expert advice to help you find the best tips and deals for managing your bills. Start saving today!
I am trying desperately to find a word for the opposite of 'dip' as in 'double-dip' and I have decided on 'pop'. Why?
Because since I wrote on Wednesday, the market did come off the pop to the 11,600 area, but then popped up again to yesterday's spike high at 11,715 and then embarked on a rapid descent to the current 11,450 area.
MoneyWeek
Subscribe to MoneyWeek today and get your first six magazine issues absolutely FREE

Sign up to Money Morning
Don't miss the latest investment and personal finances news, market analysis, plus money-saving tips with our free twice-daily newsletter
Don't miss the latest investment and personal finances news, market analysis, plus money-saving tips with our free twice-daily newsletter
My stop was touched later on Wednesday for a break even trade.
Trading tip: When trying to pick tops, I have found that the most effective strategy for order management is to identify a possible top as I did from my tramline, Elliott wave and Fibonacci analysis in my last post.
Then I set a resting sell order there (with protective stop at 3%), and most of the time, the market will move into profit quite quickly. Then, I bring in my break-even rule in case the market moves up even higher.
I may have to do this several times (see my efforts in gold around the $1,620 area!) before I find success.
But if I have found a big top, the effort will be very worthwhile.
OK, let's see what the updated chart looks like:
(Click on the chart for a larger version)
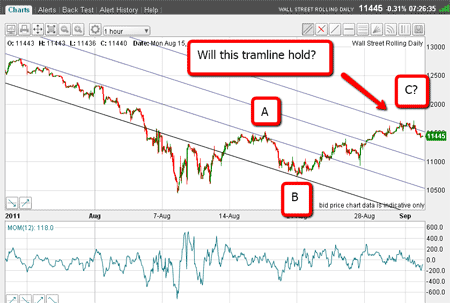
The market is still toying with the fourth tramline, but this morning, it is backing off.
There is a clear A-B-C corrective pattern off the 10,450 low, and wave C is almost equal to wave A in height a very common relationship.
The odds are very much stacking towards yesterday's 11,715 high being my wave 4 (see posts) in the very large Elliott wave pattern starting from the 12,800 April high.
The next wave will be wave 5 to below the old 10,450 low.
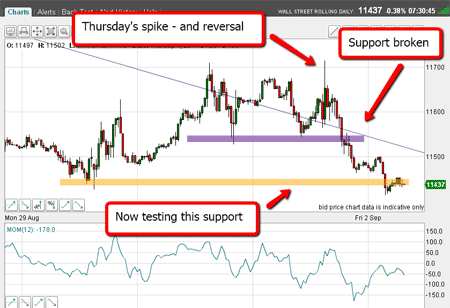
The Dow has broken through one support level and is testing a second
On Wednesday, I identified two support levels where sell orders could be placed. The first has broken, and the second is being tested as I write:
(Click on the chart for a larger version)
Short trades placed at the upper level (11,550) can now be protected with a break-even stop.
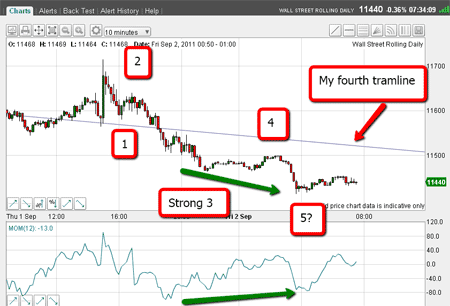
But what is giving me much more hope that the downtrend has resumed is the shape of the decline from yesterday's 11,715 high.
Below is a short-term chart showing a pretty clear five-wave structure down to this morning's low:
(Click on the chart for a larger version)
The market has started on a new leg down
The third wave is strong and deep, thus following one of the guidelines I use.
That is what I am looking for as it confirms that we have started a new leg down, according to Elliott wave theory.
This morning, the market is trying to rally. And it might, but rallies are there to be sold!
It might even try to get back to my fourth tramline in an A-B-C pattern. Wouldn't that be pretty?
Note the potential positive momentum divergence here, which may support a rally.
But, of course, the actual fifth wave may lie at lower levels, and we may have more downside to go before any meaningful rally.
The support marked by the yellow bar in the second chart may just collapse. That would strengthen my case for yesterday's high being the top.
Trading Tip: Elliott wave theory gives you an indication of the way ahead, based upon time-tested patterns that have proven themselves over many years and in many markets and in many timeframes.
I willbe posting the second of my video tutorials on Monday an introduction to Elliott waves.
It is a short, easy-to-grasp lesson in which I use two of the basic Elliott wave concepts along with a few guidelines. I'm sure these ideas can help you in your trading performance and are well worth the effort in learning.
Incidentally, I shall be taking a short break next week and will return on Thursday.
Don't miss my next trading insight. To receive all my spread betting blog posts by email, as soon as I've written them, just sign up here .
-
 Average UK house price reaches £300,000 for first time, Halifax says
While the average house price has topped £300k, regional disparities still remain, Halifax finds.
-
 Barings Emerging Europe trust bounces back from Russia woes
Barings Emerging Europe trust has added the Middle East and Africa to its mandate, delivering a strong recovery, says Max King

