The dollar makes its turn – but will it last?
The dollar has made a change of course in the charts. John C Burford goes in search of a low-risk trade.
Get the latest financial news, insights and expert analysis from our award-winning MoneyWeek team, to help you understand what really matters when it comes to your finances.
You are now subscribed
Your newsletter sign-up was successful
Want to add more newsletters?

Twice daily
MoneyWeek
Get the latest financial news, insights and expert analysis from our award-winning MoneyWeek team, to help you understand what really matters when it comes to your finances.

Four times a week
Look After My Bills
Sign up to our free money-saving newsletter, filled with the latest news and expert advice to help you find the best tips and deals for managing your bills. Start saving today!
On Wednesday, I suggested that the US dollar was ripe for a turn to the downside following its scorching bull run over the past few weeks (much to the amazement of the majority, of course).
What I wrote then was: "I have placed my Elliott wave (EW) labels where the latest plunge is a clear third wave (it is long and very strong). And now, the market is entering the price region where the previous major low was made, and this represents potential support. The third wave may have trouble getting through this area, and would be a fitting place for the third wave to terminate".
Today, I want to continue the AUS/USD story and check to see if my question has already been answered in the affirmative.
MoneyWeek
Subscribe to MoneyWeek today and get your first six magazine issues absolutely FREE

Sign up to Money Morning
Don't miss the latest investment and personal finances news, market analysis, plus money-saving tips with our free twice-daily newsletter
Don't miss the latest investment and personal finances news, market analysis, plus money-saving tips with our free twice-daily newsletter
Have we started the fourth wave?
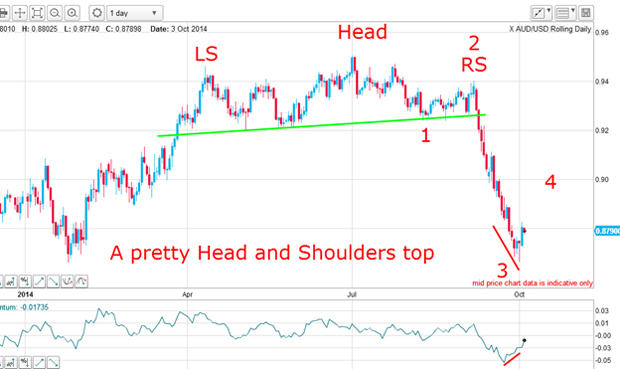
Here is the daily chart from Wednesday updated:

The decline off the 5 September 0.94 high was relentless with far more down days than up days, and the average down day was larger than the average up day. That is typical of motive third waves and that is why I am confident with my EW labels, although uncertain if wave 3 has completed.
Of course, it is too soon to say definitively that the third wave has terminated, but one additional piece of evidence is the positive momentum divergence at the Wednesday's low (red bar). This divergence is very often a precursor to a trend change of some kind.
Whether the budding rally morphs into a fourth wave is something we can only guess at just yet. But the odds are stacking up.
But note the classic head and shoulders top that formed from April. The momentum going into the head was weaker than that at the left shoulder a basic requirement for this pattern. And when the neckline (green line) was broken, that was the ideal trade entry. You had a very high confidence trade there.
If we have started the fourth wave up then it should last several weeks. That would be on a similar scale as the other waves. Wave 1 lasted five to six weeks and wave 2 lasted about four weeks. At this stage, I estimate wave 4 would last at least four weeks. Remember, fourth waves can often be complex affairs and take some time to play out.
The market hits my third tramline target
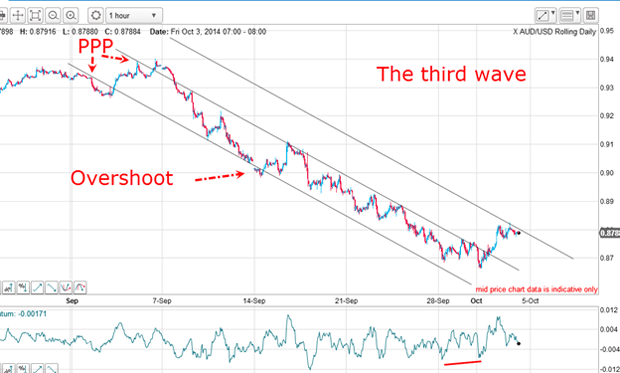
Now let's zoom in on the hourly chart:

I started looking for my first tramline with the centre one where I adjusted my line until I captured the greatest number of accurate touch points, especially during the most recent action. That gave me an excellent PPP (prior pivot point) as marked.
For the second tramline I placed it so that I captured its PPP (also as marked). That gave me a line with several accurate touch points as well as an overshoot, which are most commonly found in strong third wave moves as the market gets ahead of itself temporarily. It quickly realises it has gone too far too fast and makes amends by over-reacting to the upside, as here!
With my tramline pair I could now draw in my third tramline, which became my first target when the centre tramline resistance was overcome on Wednesday.
And overnight, the market has hit my third tramline target.
Naturally, if you were expecting a fourth wave rally (as we were), that break was the ideal spot to take profits on your shorts and even reverse positions in a long trade.
What if the third wave isn't finished?
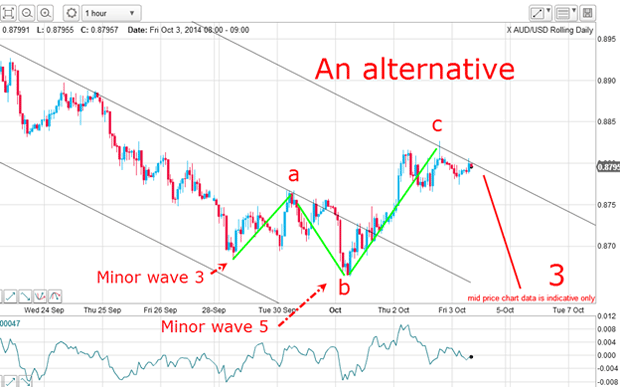
Of course, there remains the possibility that wave 3 hasn't yet completed. Here is an alternative possibility:

The third wave hit yesterday is the c wave of an a-b-c, which leads to our wave 3 extending below the minor wave 5/b wave low before turning up in wave 4.
Under this option, a low-risk trade is presented. Can you spot it?
But at least, the plan to take the major profit on the centre tramline break and even go long there gave us the opportunity to align with a possible large wave 4 rally. Of course, if the latter scenario plays out, we have protected the long trade by moving the protective stop to break even and console ourselves with the huge profit already banked.
But at some point a large multi-week wave 4 rally appears on the cards.
Get the latest financial news, insights and expert analysis from our award-winning MoneyWeek team, to help you understand what really matters when it comes to your finances.
John is is a British-born lapsed PhD physicist, who previously worked for Nasa on the Mars exploration team. He is a former commodity trading advisor with the US Commodities Futures Trading Commission, and worked in a boutique futures house in California in the 1980s.
He was a partner in one of the first futures newsletter advisory services, based in Washington DC, specialising in pork bellies and currencies. John is primarily a chart-reading trader, having cut his trading teeth in the days before PCs.
As well as his work in the financial world, he has launched, run and sold several 'real' businesses producing 'real' products.
-
 Average UK house price reaches £300,000 for first time, Halifax says
While the average house price has topped £300k, regional disparities still remain, Halifax finds.
-
 Barings Emerging Europe trust bounces back from Russia woes
Barings Emerging Europe trust has added the Middle East and Africa to its mandate, delivering a strong recovery, says Max King