Will October see a turn in the US dollar?
The Australian dollar may have fallen too far, too fast. John C Burford looks to the charts for what that means for its American counterpart.
Get the latest financial news, insights and expert analysis from our award-winning MoneyWeek team, to help you understand what really matters when it comes to your finances.
You are now subscribed
Your newsletter sign-up was successful
Want to add more newsletters?

Twice daily
MoneyWeek
Get the latest financial news, insights and expert analysis from our award-winning MoneyWeek team, to help you understand what really matters when it comes to your finances.

Four times a week
Look After My Bills
Sign up to our free money-saving newsletter, filled with the latest news and expert advice to help you find the best tips and deals for managing your bills. Start saving today!
Another month, another market. And today, I am wondering if this well-known aphorism will prove appropriate to the US dollar, which has been on a tear in recent weeks. On Monday, I outlined how the euro has been well and truly clobbered by the rampant dollar.
Suddenly, the world is waking up to the realisation that the dollar is not yet doomed, as the prevailing opinion had it a few months ago.
But I want to take a look at the AUS/USD today and examine whether the Aussie has fallen too far, too fast. In other words, can we expect a reversal any time soon?
MoneyWeek
Subscribe to MoneyWeek today and get your first six magazine issues absolutely FREE

Sign up to Money Morning
Don't miss the latest investment and personal finances news, market analysis, plus money-saving tips with our free twice-daily newsletter
Don't miss the latest investment and personal finances news, market analysis, plus money-saving tips with our free twice-daily newsletter
At the same time, this will give me an opportunity to lay out how I go about analysing a market.
As usual, there are rational reasons for the decline in the Aussie. It is first and foremost a commodity-based currency, because the commodity export sector vastly overshadows all other export sectors. Any decline in commodity demand will quickly show up in the exchange rate.
And Australia's biggest customer by far is China, whose economy is now slowing rapidly, as shown by the plunge in the price of iron ore a major Australian product. A declining Aussie dollar makes sense. But because I believe the charts are telling the real story, let's get to them.
What the charts are telling us
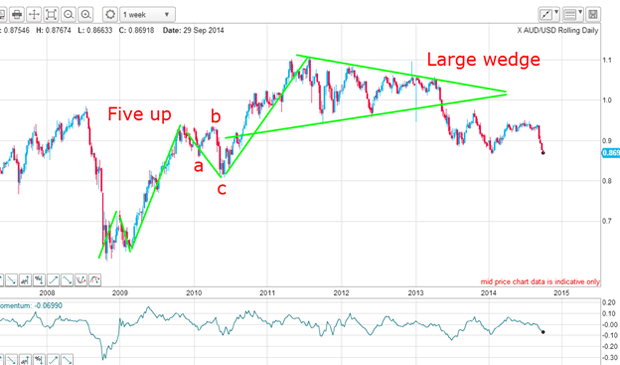
I always start with the long-term chart. This is the weekly chart going back to 2008:

There is a lot going on here and I will show two versions of the weekly.
The rally off the 2008 plunge low (the famous credit crunch market) occurred in five clear waves (green lines).
Let me check off to see that the Elliott wave rules have been obeyed:

The third wave is the strongest with highest momentum readings. Check.
The fourth wave is in an A-B-C form. Check.
The final fifth wave is extended and itself is made up of its own motive five waves. Extended fifth waves are entirely typical in currency markets more so than in any other market. Check.
The five up waves have completed the bull phase and conditions are ripe for a new bear trend.
Then, from 2011 to 2013, the market traced out a very large wedge. The wedge is a very powerful pattern and is one of my five top trade setups. I liken a wedge to a spring that is gradually wound tighter and tighter until it breaks and then pandemonium ensues (at least as experienced by the bulls).
The break of the lower wedge line was a clear signal that the trend had changed to down and that short trades were going to be the most profitable.
Markets have long memories
Here are more features that I can pinpoint:

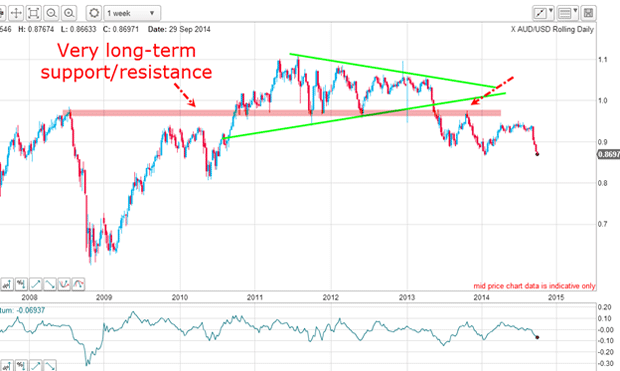
I have marked in pink the region that represents very long-term support/resistance that has applied since at least 2008. Evidently, the market respects the 0.970.98 region as a highly significant price area. Remember, markets have long memories.
Note how the rally in late 2013 was stopped in its tracks when it ventured into the 0.98 area (red arrow).
So, now I have established that the long-term trend is down. What can the shorter time frame tell us, and can I find any relevant tramlines? That is my next task.
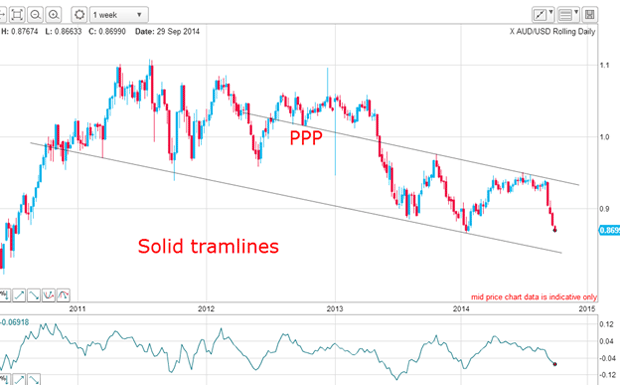
Here is a solid tramline pair with the upper line having a good PPP (prior pivot point), and the lower line having two recent accurate touch points. In late 2011, there is a pigtail, which is allowed under my tramline rules.
So, now the picture is getting clearer the trend is firmly down and I have a tramline target on the lower tramline in the 0.84 area, depending on how long the market takes to reach it.
Will we see a fourth wave rally?
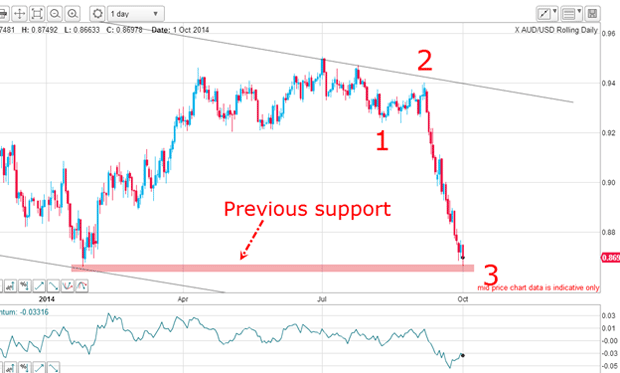
Now let's zero in on the daily chart:

I have placed my Elliott wave labels where the latest plunge is a clear third wave (it is long and very strong). And now, the market is entering the price region where the previous major low was made, and this represents potential support. The third wave may have trouble getting through this area, and would be a fitting place for the third wave to terminate.
Momentum has become very oversold and if this support holds, we shall see a fourth wave rally. That would be an excellent time for bearish traders to look to enter trades.
Traders already short will be looking to take at least partial profits around here.
One final thought: because bullish sentiment towards the euro reached an incredibly minuscule 3% recently, the snap-back is very likely to be violent and sharp. This is because even a small buying interest will be hitting a mountain of buy-stops and lighting the blue touch paper in a huge short-squeeze rocket.
So, maybe October will turn out to be another market!
Get the latest financial news, insights and expert analysis from our award-winning MoneyWeek team, to help you understand what really matters when it comes to your finances.
John is is a British-born lapsed PhD physicist, who previously worked for Nasa on the Mars exploration team. He is a former commodity trading advisor with the US Commodities Futures Trading Commission, and worked in a boutique futures house in California in the 1980s.
He was a partner in one of the first futures newsletter advisory services, based in Washington DC, specialising in pork bellies and currencies. John is primarily a chart-reading trader, having cut his trading teeth in the days before PCs.
As well as his work in the financial world, he has launched, run and sold several 'real' businesses producing 'real' products.
-
 ISA fund and trust picks for every type of investor – which could work for you?
Whether you’re an ISA investor seeking reliable returns, looking to add a bit more risk to your portfolio or are new to investing, MoneyWeek asked the experts for funds and investment trusts you could consider in 2026
-
 The most popular fund sectors of 2025 as investor outflows continue
It was another difficult year for fund inflows but there are signs that investors are returning to the financial markets