The Dax could have produced a 'whale trade'
Mastery of Elliott wave theory can translate into huge profits from Germany's benchmark index. John C Burford explains.
Get the latest financial news, insights and expert analysis from our award-winning MoneyWeek team, to help you understand what really matters when it comes to your finances.
You are now subscribed
Your newsletter sign-up was successful
Want to add more newsletters?

Twice daily
MoneyWeek
Get the latest financial news, insights and expert analysis from our award-winning MoneyWeek team, to help you understand what really matters when it comes to your finances.

Four times a week
Look After My Bills
Sign up to our free money-saving newsletter, filled with the latest news and expert advice to help you find the best tips and deals for managing your bills. Start saving today!
With the Greek panto taking centre stage, the German Dax has been whipping around with abandon. It has still managed to trade within my excellent tramlines, described in my post of 24 June. But my original large-scale Elliott wave count now has some competition, as I mentioned.
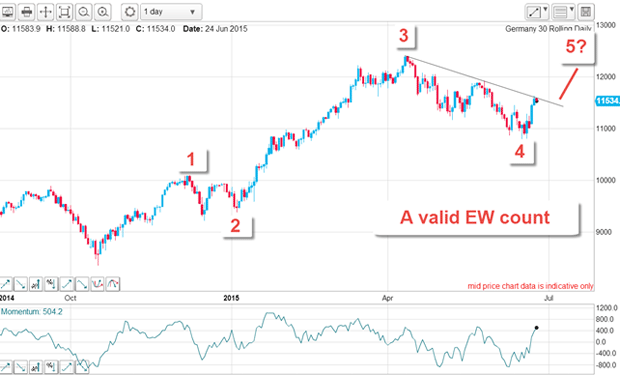
Below is the Elliott wave count I suggested back then. Of course, the reason we need to have the large-scale picture is to give us the current major trend as well as likely turning points. For example, if you can locate the start of a wave 3 as wave 2 completes, then you could have a 'whale trade' on your hands and these are well worth catching, because they offer huge gains with very minor pull-backs.
The chart shows what such a trade could have produced at least 2,000 points in about three months. That would be classed as a whale trade in my book. But back in January, this was a mere glint in the trader's eye.
MoneyWeek
Subscribe to MoneyWeek today and get your first six magazine issues absolutely FREE

Sign up to Money Morning
Don't miss the latest investment and personal finances news, market analysis, plus money-saving tips with our free twice-daily newsletter
Don't miss the latest investment and personal finances news, market analysis, plus money-saving tips with our free twice-daily newsletter

You need to be able to make forecasts based on current knowledge and then see if the market follows your roadmap as time goes by. If it doesn't, then maybe it's back to the drawing board.
The jury is still out as to whether this is the start of a bear phase
If the market was turned back at the resistance provided by that tramline, an alternate Elliott wave count would become a real possibility. After all, it is vitally important to know whether the April high was the top or not. We need to know whether we are still in a bull market or at the start of a bear phase. For a swing trader, this is the crux of the matter.
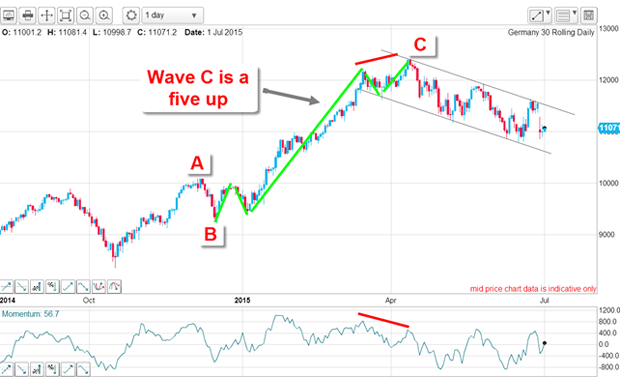
Here is the alternative large-scale Elliott wave count. The rally off the October low under this count is an A-B-C with the C wave containing a very clear five up (blue bars) with a large negative-momentum divergence at the w5/wC high. In other words, a textbook pattern.
Today, the jury is still out over which count is operative. But the sharp decline off the upper tramline was certainly not a bullish move.

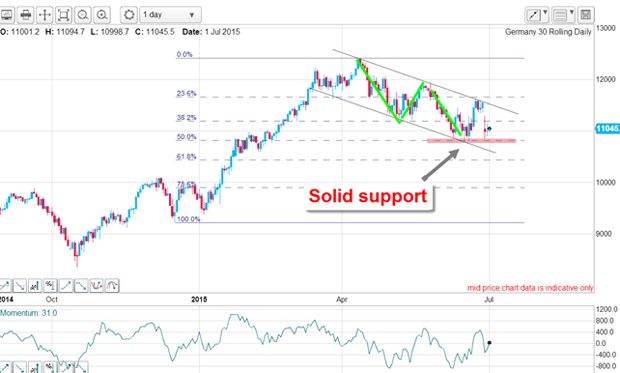
Here is the daily chart showing the tramlines of the decline off the high. The decline is an A-B-C so far, which is corrective and implies new highs ahead. And the decline was stopped at the Fibonacci 50% retrace of the rally off the December low. But that level is also the Fibonacci 38% retrace of the rally off the October low. This coincidence amplifies the degree of support here and the sharp bounce to the upper tramline last week was the result.

So now, we have conflicting clues as to market direction.
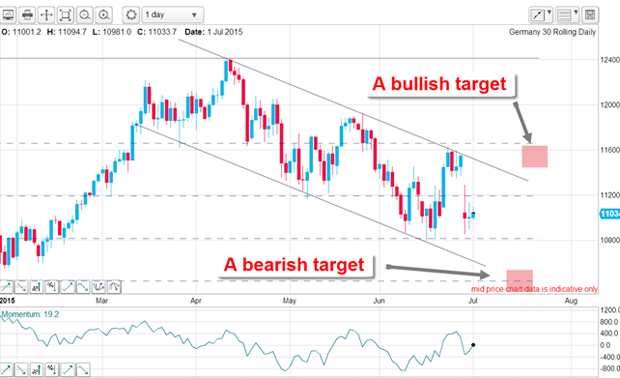
Monday's huge gap down is a rare feature in these days of virtually 24/7 trading. It is worthy of note and the power of the thrust down indicates the upper tramline resistance is strong. Most gaps are filled pretty quickly, so a rally from here is certainly possible.
But if the market can break below the pink line of solid support, that would open up a vision of the market falling to the next level the Fibonacci 62% which would probably coincide with meeting the lower tramline.
The market is in limbo
But if the market rallies from here, a test of the upper tramline becomes likely and if broken, my upper pink zone becomes my bullish target.

Meanwhile, the market is in limbo and we shall have to wait until a resolution appears. But while the direction of the eurozone is up in the air with Greece having defaulted on an International Monetary Fund (IMF) loan, I expect the market to remain in this state for a while. Trading it will be very tough and profits hard to come by. I shall be standing aside for now.
Get the latest financial news, insights and expert analysis from our award-winning MoneyWeek team, to help you understand what really matters when it comes to your finances.
John is is a British-born lapsed PhD physicist, who previously worked for Nasa on the Mars exploration team. He is a former commodity trading advisor with the US Commodities Futures Trading Commission, and worked in a boutique futures house in California in the 1980s.
He was a partner in one of the first futures newsletter advisory services, based in Washington DC, specialising in pork bellies and currencies. John is primarily a chart-reading trader, having cut his trading teeth in the days before PCs.
As well as his work in the financial world, he has launched, run and sold several 'real' businesses producing 'real' products.
-
 Inheritance tax investigations net HMRC an extra £246m from bereaved families
HMRC embarked on almost 4,000 probes into unpaid inheritance tax in the year to last April, new figures show, in an increasingly tough crackdown on families it thinks have tried to evade their full bill
-
 Average UK house price reaches £300,000 for first time, Halifax says
While the average house price has topped £300k, regional disparities still remain, Halifax finds.