Europe’s going haywire – let’s get stuck in
Stockmarkets are volatile as the Greek debacle continues. John C Burford explains why that's a dream setup for swing traders.
Get the latest financial news, insights and expert analysis from our award-winning MoneyWeek team, to help you understand what really matters when it comes to your finances.
You are now subscribed
Your newsletter sign-up was successful
Want to add more newsletters?

Twice daily
MoneyWeek
Get the latest financial news, insights and expert analysis from our award-winning MoneyWeek team, to help you understand what really matters when it comes to your finances.

Four times a week
Look After My Bills
Sign up to our free money-saving newsletter, filled with the latest news and expert advice to help you find the best tips and deals for managing your bills. Start saving today!
I sat down this morning to write about the impending agreement between Greece and itscreditors. Well, so much for that. The Greek panto continues, and the markets look set to remain volatile for at least a little while longer.
As swing traders, we're primarily interested in one thing: finding great trade setups.
If we do eventually see a further extension of the ongoing 'extend and pretend' debt operations operations that depend upon a certain confidence in the future we can be reasonably sure that sentiment remains bullish.
MoneyWeek
Subscribe to MoneyWeek today and get your first six magazine issues absolutely FREE

Sign up to Money Morning
Don't miss the latest investment and personal finances news, market analysis, plus money-saving tips with our free twice-daily newsletter
Don't miss the latest investment and personal finances news, market analysis, plus money-saving tips with our free twice-daily newsletter
If the public mood were bearish, it is very doubtful Greece would be rescued again.
And that is why stockmarkets the most immediate barometer of public mood reacted positively earlier this week. The index with the greatest exposure to eurozone affairs is the German Dax, and I have been following that index closely.
A perfect tramline pair let me set my stall out early
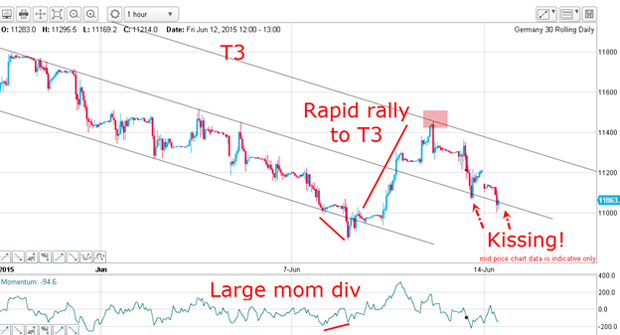
I was working with excellent tramlines and the market had dipped to kiss the centre tramline. But would the market immediately rally from there?
In fact, it had one more dip and I was then able to draw in a better tramline trio:
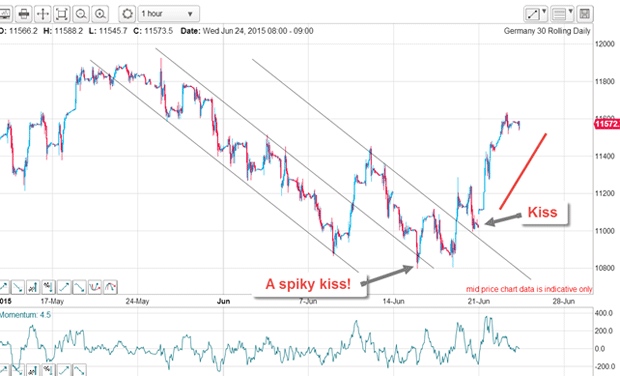
The market did slightly overshoot my centre tramline, but then girded its loins and rallied past the upper tramline but not before planting a kiss. The market then roared up in a traditional scalded-cat bounce.
Remember, when you see the market kissing a tramline, look out for a rapid rejection of that line that's what I call a scalded-cat bounce. When you see that, it is a great trading signal.
So, where does this action fit into the bigger picture this morning?
I have a superb tramline trio on the daily chart the first tramline I drew was the obvious centre line, which has all of the lovely major lows in the period. I then drew the upper tramline, which takes in sufficient major highs (highlighted) to validate that as a reliable line of resistance.
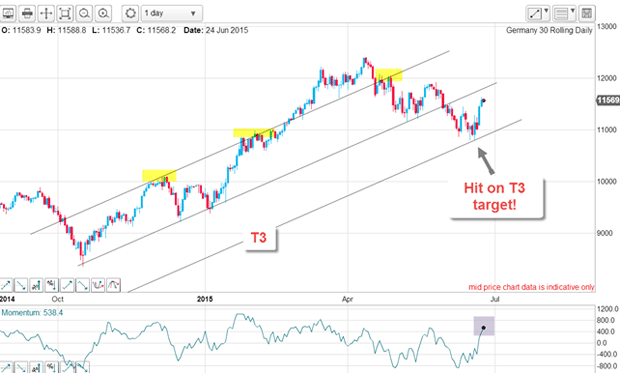
Finally, and because the centre tramline had been broken, I drew in T3 equidistant. And lo and behold, the recent decline stopped right on my T3 target.
Remember, I could draw T3 immediately when the centre tramline had been broken. That gave me several days to prepare for taking profits at my pre-determined target. And that is one of the major benefits of using this particular trading method.
What's next for the Dax?
Let's now zoom in and take a closer look:
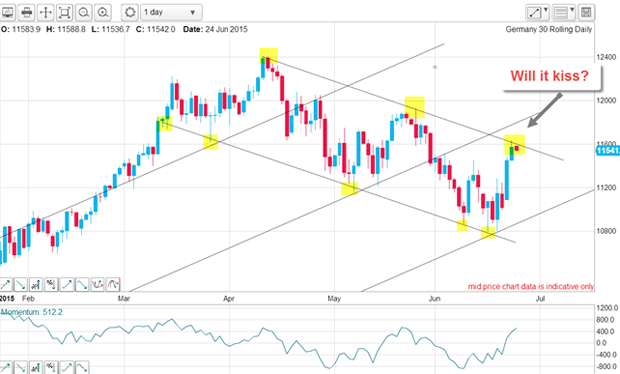
Now, I have a lovely down-sloping tramline pair with many excellent touch points. This morning, the market has carried right to the upper tramline and is currently testing resistance on that over-stretched momentum.
There remains a gap up to the centre tramline where the kiss, if it occurs, would be placed. But note the form of the decline it is clearly in an A-B-C form, and that is always counter-trend, which implies the resistance will likely be overcome and the kiss planted.
Finally, how do these patterns fit into the larger Elliott waves?
This is the daily chart from the October 2014 low, and it shows a typical wave pattern of a bull market. My wave 3 is long and strong and all of the waves look in proportion (a necessary condition for a valid count).
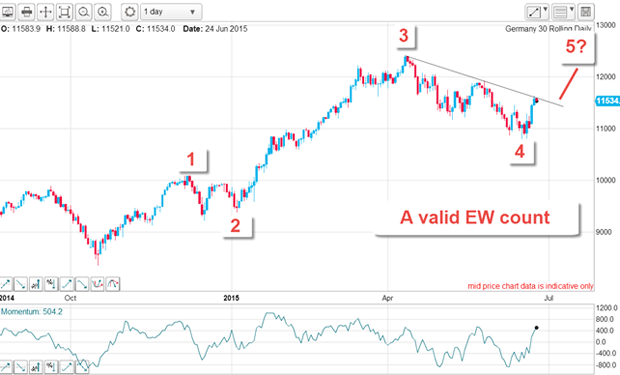
Wave 4 has that typical A-B-C form of a fourth wave. The conclusion? Expect the market to move higher into wave 5 and into new high ground above the wave 3 high.
As ever, there is an alternative scenario that has the April high as the all-time high and the market now in a bear trend.
I will cover that scenario in later emails. But in the meantime, the market is offering some great short-term trades off the hourly chart.
Get the latest financial news, insights and expert analysis from our award-winning MoneyWeek team, to help you understand what really matters when it comes to your finances.
John is is a British-born lapsed PhD physicist, who previously worked for Nasa on the Mars exploration team. He is a former commodity trading advisor with the US Commodities Futures Trading Commission, and worked in a boutique futures house in California in the 1980s.
He was a partner in one of the first futures newsletter advisory services, based in Washington DC, specialising in pork bellies and currencies. John is primarily a chart-reading trader, having cut his trading teeth in the days before PCs.
As well as his work in the financial world, he has launched, run and sold several 'real' businesses producing 'real' products.
-
 ISA fund and trust picks for every type of investor – which could work for you?
Whether you’re an ISA investor seeking reliable returns, looking to add a bit more risk to your portfolio or are new to investing, MoneyWeek asked the experts for funds and investment trusts you could consider in 2026
-
 The most popular fund sectors of 2025 as investor outflows continue
It was another difficult year for fund inflows but there are signs that investors are returning to the financial markets