You are now subscribed
Your newsletter sign-up was successful
Want to add more newsletters?

Twice daily
MoneyWeek
Get the latest financial news, insights and expert analysis from our award-winning MoneyWeek team, to help you understand what really matters when it comes to your finances.

Four times a week
Look After My Bills
Sign up to our free money-saving newsletter, filled with the latest news and expert advice to help you find the best tips and deals for managing your bills. Start saving today!
In my last post covering the dollar on 3 October, I charted the progress of the Aussie dollar against the US dollar. I noted the powerful head and shoulders reversal pattern on the daily chart which led to a strong third wave down:
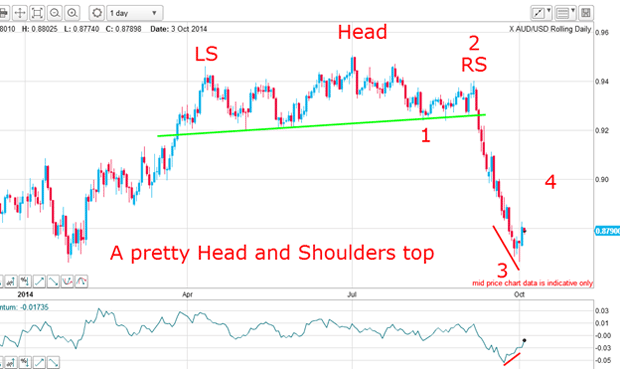
The market had started a bounce in what I suggested was a fourth wave up.
MoneyWeek
Subscribe to MoneyWeek today and get your first six magazine issues absolutely FREE

Sign up to Money Morning
Don't miss the latest investment and personal finances news, market analysis, plus money-saving tips with our free twice-daily newsletter
Don't miss the latest investment and personal finances news, market analysis, plus money-saving tips with our free twice-daily newsletter
This is what I wrote: "If we have started the fourth wave up then it should last several weeks. That would be on a similar scale as the other waves. Wave 1 lasted five to six weeks and wave 2 lasted about four weeks. At this stage, I estimate wave 4 would last at least four weeks. Remember, fourth waves can often be complex affairs and take some time to play out".
So let's check on the progress of my fourth wave.
How to decide which tramline set is working best
Here is the hourly chart:
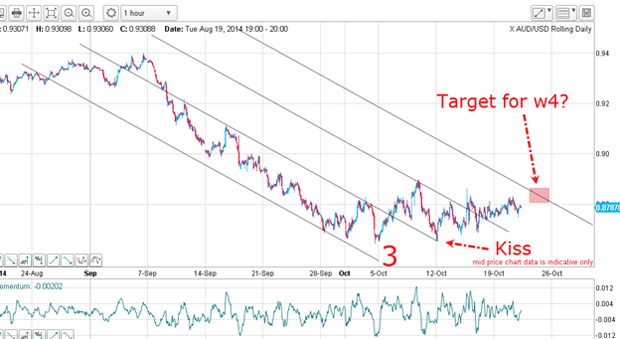
Sharp-eyed readers will have spotted that I have different tramlines from those on my original chart. The action following my 3 October chart impelled me to look for new and better-fitting tramlines.
Why? Simply because of the sharp dip and recovery of 10 October. Now this spike low becomes a kiss on my new tramline.
The tramline kiss is one of the must-see features that helps me decide which tramline set is working best. And following a kiss, I like to see a scalded-cat bounce and in this case the market duly obliged.
The bottom line: this is the tramline set I shall be working with until proved otherwise.
Did I find my low-risk trade?
Recall I projected a w4 lasting at least four weeks: how long has it been in progress now? From the wave 3 low in early October, wave 4 has been developing for almost four weeks. It can unfurl for longer, of course, but my minimum time requirement has been met.
And my ideal target is the fourth tramline.
But the shape of this wave 4 is entirely typical very complex. Only Elliott wave theory (EWT) can give you this insight. Fourth waves are often a whipsaw graveyard!
Remember the question I posed last time? Was there a low-risk trade?
This was the chart then:
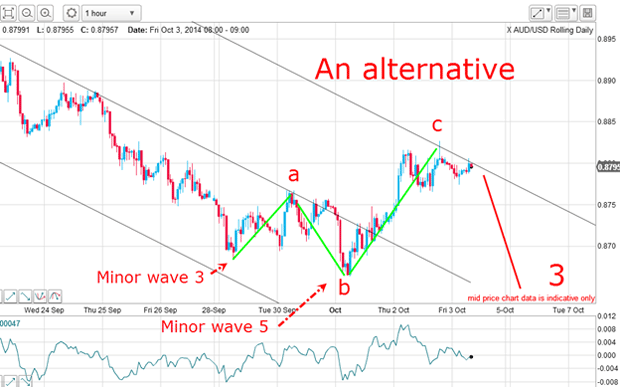
The market had hit resistance at my third tramline and momentum was weakening. And there was a mini wedge forming and breaks out of wedges are often very sharp. That is what makes them well worth trading.
Here is what happened:
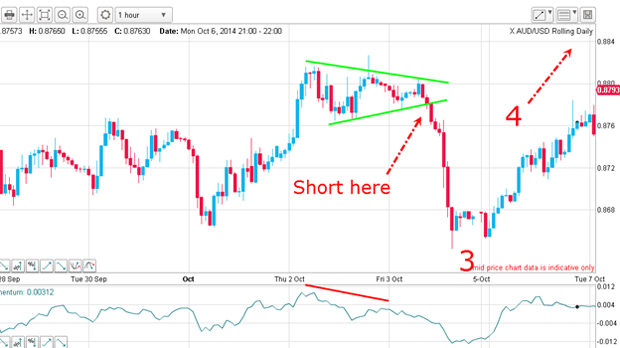
When the lower wedge line was broken, that indicated a sharp move down and a sell-stop placed on the break was the correct trade. And about 100 pips was available on this short-term trade. It also confirmed my Elliott wave labels!
My Elliott wave roadmap for the Aussie
In Monday'spost, I noted that the EWT gives you a roadmap, and this little example I've shown today is another case in point.
Now, why was a short-term trade preferred here? Simply because the market had already fallen very hard in wave 3 and with a highly oversold condition, downward breaks would likely not carry too far before a counter-trend rally started.
And that is precisely what occurred. From the 6 October lows, the market has staged a strong rally.
The final plunge out of the wedge was the final selling climax of the entire third wave. But when wave 4 completes, I expect another downward lurch in wave 5. That is my Elliott wave roadmap for the Aussie.
-
 MoneyWeek Talks: The funds to choose in 2026
Podcast Fidelity's Tom Stevenson reveals his top three funds for 2026 for your ISA or self-invested personal pension
-
 Three companies with deep economic moats to buy now
Opinion An economic moat can underpin a company's future returns. Here, Imran Sattar, portfolio manager at Edinburgh Investment Trust, selects three stocks to buy now

