Madness and mania in the stock market
Many analysts believe today's high stock-market prices are justified. That's wishful thinking, says John C Burford - stocks are in a bubble.
Get the latest financial news, insights and expert analysis from our award-winning MoneyWeek team, to help you understand what really matters when it comes to your finances.
You are now subscribed
Your newsletter sign-up was successful
Want to add more newsletters?

Twice daily
MoneyWeek
Get the latest financial news, insights and expert analysis from our award-winning MoneyWeek team, to help you understand what really matters when it comes to your finances.

Four times a week
Look After My Bills
Sign up to our free money-saving newsletter, filled with the latest news and expert advice to help you find the best tips and deals for managing your bills. Start saving today!
Are stock markets, which are very close to their all-time highs, being propelled by an extreme state of euphoria by investors, who are engaged in a classic mania? And can stocks be said to be in a bubble?
There are plenty of analysts that maintain that today's stock valuations are not outlandish (the new normal') and are entirely justified. To me, this seems to be wishful thinking they are disregarding evidence, because they want to believe this is the new normal'.
So today, I want to tell you why I believe that stock markets are indeed in a bubble.
MoneyWeek
Subscribe to MoneyWeek today and get your first six magazine issues absolutely FREE

Sign up to Money Morning
Don't miss the latest investment and personal finances news, market analysis, plus money-saving tips with our free twice-daily newsletter
Don't miss the latest investment and personal finances news, market analysis, plus money-saving tips with our free twice-daily newsletter
This is what happens when the herd goes haywire
"Mania: an extreme enthusiasm for something that is usually shared by many people."
"Euphoria: a personal feeling of great happiness and excitement."
Euphoria is felt by the individual, while a financial mania is a manifestation of a large group of euphoric individuals (a herd).
One of the notable features of a herd mania is that the members disregard every piece of evidence that contradicts their core beliefs sometimes violently. The word mania has the same root as madness and indeed, a mania is a kind of madness, where the collective mind of the herd goes haywire and divorces from reality.
One of the classic books on the subject is Charles Mackay's Extraordinary popular pelusions and the madness of crowds. In the financial arena, he tells the stories of the South Sea Bubble and the Holland Tulip Mania - these are both well-known cases of extreme mania and introduces the term bubble for a financial mania.
Sir Isaac Newton's nightmare
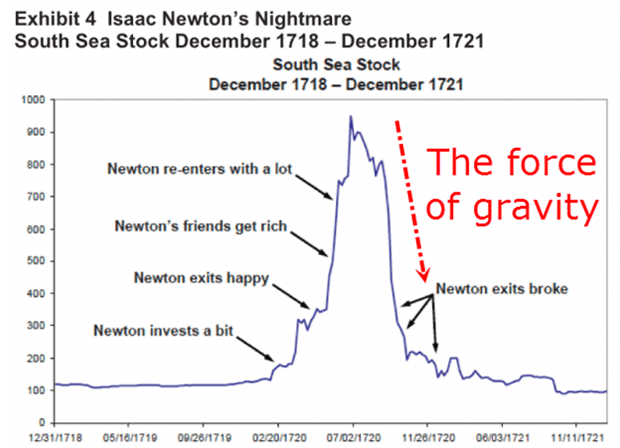
Here is a chart of Newton's exploits as a stock picker:

Evidently, he hadn't considered the possibility of gravitation working on stock prices. Incidentally, according to the chart, the high was a little short of the round-number £1,000 level. I can imagine this was a widely-touted forecast on the way up to the 1720 high and served as a lure to bring more investors in. That is what these round-number forecasts do. It is a call to buy me'.
I have found near-misses of a round number target are a very common occurrence. Remember the $2,000 forecast for the gold mania in the period up to 2011? The high fell short of that forecast too. And I covered the recent near-miss of the $1,400 level in gold in March this year.
The shape of the above chart is entirely typical of a mania stock straight up and then straight down. But the shape applies to only one type of stock one that has little tangible value behind it (in less technical jargon, a scam).
There were many such faith' stocks in the dot-com mania of the 1990s. I recall reading many online chat rooms at the time that were filled with wildly euphoric posts. It was eyeballs that counted, not profits. What utter madness.
In the rally phase, bullish sentiment grew as the market rose. Imagine an investor buying in the £100 - £200 range, as Newton did. As the market passed the £500, then £700, then £900 levels, he or she would naturally feel more and more euphoric.
What an investing genius I am! It's going to £1,000 for sure and maybe to the moon! I'm buying more. And Newton paid the price.
A good investor goes against the herd
But for assets that do have tangible value, such as the major stock indexes, whose component stocks are profitable and dividend-payers, the shape of the typical top is nothing like this. Here, tops are rounded affairs, because a top marks the transition from hope (up) to a gradual realisation that the hope will not be realised.
That is where the faithful refuse to see the game has changed and will hang on until they are forced to sell, usually at much lower prices, as Newton did. It is this relentless long liquidation that produces the steep falls that stand out on the charts.
I read many pundits who are calling for a melt-up' prior to any lasting top. This is most unlikely, as history is bereft of such patterns. In the major stock indexes, dips are usually bought as investors see a chance to grab shares on the cheap'. This produces the deep upward retracements we commonly see.
Don't ignore the evidence this is a mania
However, major bottoms are totally different affairs. Here, we usually see huge spikes at the lows. The example of March 2009 is a vivid example. This is because the low is the transition from total despair (down) to hope (up) as investors really do grab shares on the cheap and there are few sellers left there.
Today, with the stark divergence between economic conditions (weak) and booming stocks, there is undoubtedly a high degree of euphoria out there and a madness that I can call a mania. Volatility is extremely low, indicating huge complacency towards a major decline. This is a perfect set-up for such an event.
I believe we are at an historic turning point in sentiment towards stocks. Naturally, the army of pundits will be trotting out the reasons' for the turn, such as Iraq, pending interest rate increases, and so on. These will only appear well after the event, of course, and provides exciting reading which sells newspapers.
Sadly, reading about it afterwards cannot give us any profits: we must be positioned well before it appears in the news.
What the Dow is showing

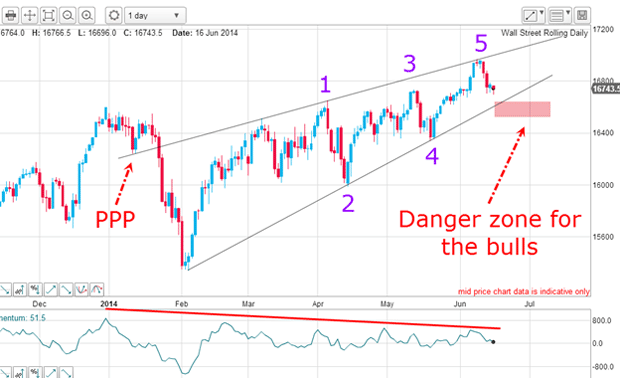
On the hourly chart, this is the wedge pattern that has been building since the February low and a classic wedge it is. I have a PPP (prior pivot point) on the upper line and three accurate touch points. On the lower line, I also have three accurate touch points. This makes the support and resistance lines very reliable.
Within the wedge, there is a pretty five-wave pattern. This form is typical of a reversal pattern. The large negative-momentum divergence also adds to the evidence of a major reversal.
A break of the lower line would really set the bulls' fur flying!
Get the latest financial news, insights and expert analysis from our award-winning MoneyWeek team, to help you understand what really matters when it comes to your finances.
John is is a British-born lapsed PhD physicist, who previously worked for Nasa on the Mars exploration team. He is a former commodity trading advisor with the US Commodities Futures Trading Commission, and worked in a boutique futures house in California in the 1980s.
He was a partner in one of the first futures newsletter advisory services, based in Washington DC, specialising in pork bellies and currencies. John is primarily a chart-reading trader, having cut his trading teeth in the days before PCs.
As well as his work in the financial world, he has launched, run and sold several 'real' businesses producing 'real' products.
-
 MoneyWeek Talks: The funds to choose in 2026
Podcast Fidelity's Tom Stevenson reveals his top three funds for 2026 for your ISA or self-invested personal pension
-
 Three companies with deep economic moats to buy now
Opinion An economic moat can underpin a company's future returns. Here, Imran Sattar, portfolio manager at Edinburgh Investment Trust, selects three stocks to buy now