On Wednesday, I outlined my case for believing stocks markets are closer to a major high than they are to the start of a major bull market (as many pundits proclaim). I illustrated this on the charts of the Russell 2,000 index.
The Russell 2,000 all-time high was made on 4 March, while the Dow's high was made on 9 June over three months later. For three months, the small caps have been diverging from the large caps. That is why I call this a fractured market.
In a healthy market, the tide of liquidity would lift all boats more or less together. In this unhealthy market, some boats have taken on too much water and are sinking!
Try 6 free issues of MoneyWeek today
Get unparalleled financial insight, analysis and expert opinion you can profit from.

Sign up to Money Morning
Don't miss the latest investment and personal finances news, market analysis, plus money-saving tips with our free twice-daily newsletter
Don't miss the latest investment and personal finances news, market analysis, plus money-saving tips with our free twice-daily newsletter
Why tramline kisses are so important
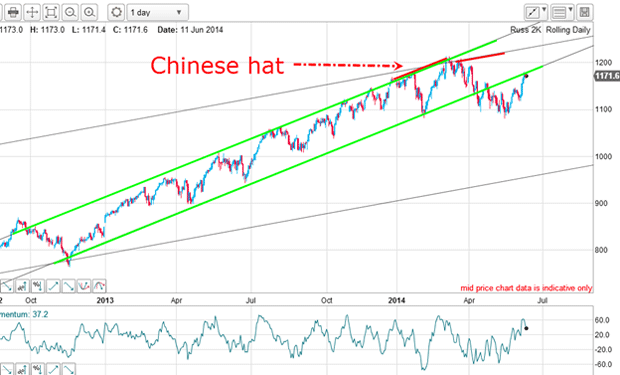
The noteworthy feature is the Chinese hat an area of extra-strong resistance. In fact, the force of selling was so strong there that the market soon broke through the lower tramline, thus changing the outlook for the immediate trend as being down.

I also noted the position on Wednesday morning, where the market had rallied to kiss the underside of the lower tramline in pure textbook fashion.
A tramline kiss is a very important event. If you have a reliable tramline, then a break and kiss can often set up a superb low-risk trade entry.
In fact, it is one of my favourite trade set-ups.
Has the main trend changed?

But first, let's examine the context for the kiss. The rally to the early March high into the Chinese hat occurred on a negative-momentum divergence, providing another clue that the next move would be down. Then, the move down from the Chinese hat is in five motive waves (marked in green). This is a vital clue that the trend has now changed.
The market then proceeded to break my lower tramline, which on Wednesday I established was a reliable line of support. With the break, it now becomes a line of resistance.
From the mid-May low, the market rallied in a normal advance to the underside of the just-broken tramline and has just planted a nice kiss on it.
Note that this rally is in a clear three-wave A-B-C form. This pattern is always counter-trend and thus confirms the trend is now down.
Also, the kiss was turned at the meeting of the Fibonacci 78% level and the tramline in a deep retracement. This is also a level of strong resistance.
The evidence is piling up that the main trend has now changed.
My roadmap for the market

And here is the C wave top:

If the pattern is repeated, we should see a move down to support, and if it breaks, we will have a head and shoulders (H&S) top with the support line providing the neckline.
One of the characteristics of an H&S top is that we can apply a very simple measuring rule for the minimum move. The rule states that at a minimum, the distance travelled after the neckline break is equal to the height of the head above the neckline.
A glance at the above chart would place that target roughly at the lower tramline (as occurred at the B wave low!). Isn't that convenient?
Not only do I have a roadmap for the market, but also a minimum price target. That is all a trading system can give you but it's enough!
This is an excellent trade opportunity
But at least, the kiss gave me an opportunity to position for an anticipated scalded-cat bounce and at low risk. And once I see that scalded-cat bounce develop, I can be more confident that my analysis is correct and lower prices beckon.