An interesting pattern forms in the Dow Jones index
John C Burford looks at a textbook Elliott wave pattern in the Dow Jones Industrials index.
Get the latest financial news, insights and expert analysis from our award-winning MoneyWeek team, to help you understand what really matters when it comes to your finances.
You are now subscribed
Your newsletter sign-up was successful
Want to add more newsletters?

Twice daily
MoneyWeek
Get the latest financial news, insights and expert analysis from our award-winning MoneyWeek team, to help you understand what really matters when it comes to your finances.

Four times a week
Look After My Bills
Sign up to our free money-saving newsletter, filled with the latest news and expert advice to help you find the best tips and deals for managing your bills. Start saving today!
I like trading the Dow Jones Industrials Index (the 'Dow') more than any other stock index. Perhaps it's because in my early trading and advising days, I seemed to gravitate towards this market it must have cast its spell!
There are only 30 stocks in the index, compared with 500 in the S&P. You might think that a big move in only one of its components would throw the index off kilter, whereas a big move in an S&P stock would not have the same impact.
I'm sure this is true, yet in my experience, the Dow conforms very closely to my Elliott wave counts, to my Fibonacci retracements, and also to my tramline methods. The same is true for the S&P.
MoneyWeek
Subscribe to MoneyWeek today and get your first six magazine issues absolutely FREE

Sign up to Money Morning
Don't miss the latest investment and personal finances news, market analysis, plus money-saving tips with our free twice-daily newsletter
Don't miss the latest investment and personal finances news, market analysis, plus money-saving tips with our free twice-daily newsletter
But because the Dow comprises the 30 biggest blue-chip companies in the US, investments in these shares are considered 'conservative' dividend-payers. On the other hand, the S&P 500 contains some smaller companies, many of which do not pay dividends and so the S&P index is considered more 'high-risk' than the Dow.
That is why the comparative performance of the two indices demonstrates the whether investors have a 'risk-on' or a 'risk-off' stance.
Investors seem to be in a 'risk-off' mood
For instance, on Tuesday, I noted that the Dow has been relatively outperforming the S&P. It has made new highs in the current bull run, whereas the S&P has not.
To me, this suggests investors are adopting a 'risk-off' strategy, and my view is supported by the recent against-expectations rally in T-bonds.
This bond rally indicates that bond investors are happy to receive a lower yield for the relative safety of US Treasuries over shares (despite whiffs of a possible US credit downgrade).
This reduction in long-term interest rates can be read in several ways one of them is to forecast deflation ahead, and not inflation, which is the prevailing opinion.
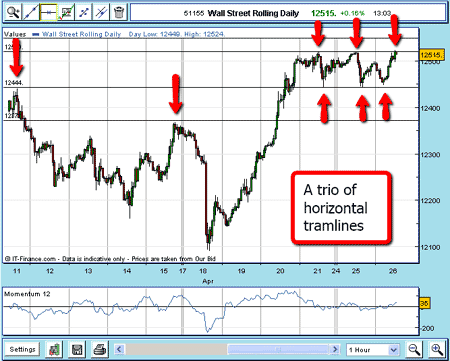
Let's get back to the Dow. Here is the hourly chart as it stood on Tuesday (26 April):

(Click on the chart for a larger version)
The first tramline I drew was the centre tramline that was easy, as the horizontal support/resistance stood out. My second tramline I drew across the tops, and so I drew a parallel equidistant line below my first line and it touches the important April 15 peak.
If you are following or trading the Dow, I suggest you replicate this chart on your own spread betting platform and keep it handy I have a feeling this lower tramline could come into play later.
Looking for wave 5
As I wrote this piece, the market was pushing up against the upper tramline.
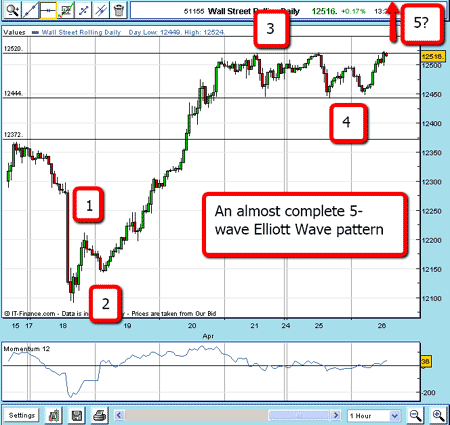
Here is a closer look:

(Click on the chart for a larger version)
The rally since the 18 April minor low is an almost-complete textbook Elliott wave pattern:
A small wave 2, but no new low
A big, strong wave 3 with huge momentum
A complex wave 4 (corrective)
If the market pushes above upper tramline, we have a potential wave 5
Let's say the market does push above my upper tramline sometime soon. That would put in place the final wave, according to Elliott. I can then expect a market turn after the wave 5 top is in.
Incidentally, this is the value of using Elliott wave principles in this case, I am projecting a further rise and then a decline.
How high will the market likely rise to? No-one can say, but I will be drawing in more tramlines above my trio to give me guidance.
Naturally, I shall be doing the same in the FTSE 100 and S&P (and probably the Nasdaq).
How did the FTSE 100 look meanwhile?
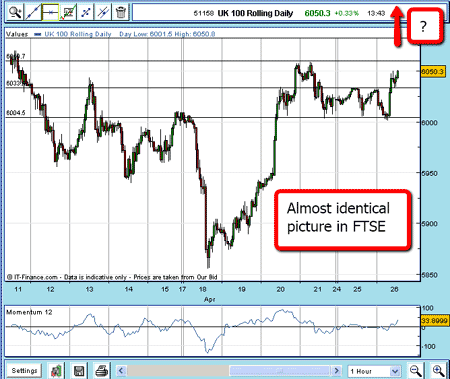
Incidentally, this was the picture in the FTSE 100:

(Click on the chart for a larger version)
Recall, I had a recent successful short trade in the FTSE where I used a combination of my tramline method and Fibonacci retracements for entry and exit points. When the Dow does turn, I shall use the very same methods in my trading.
I shall follow these developments and publish another post when I see the need.
NB: Don't miss my next trading insight. To receive all my spread betting blog posts by email, as soon as I've written them, just sign up here .
Get the latest financial news, insights and expert analysis from our award-winning MoneyWeek team, to help you understand what really matters when it comes to your finances.
John is is a British-born lapsed PhD physicist, who previously worked for Nasa on the Mars exploration team. He is a former commodity trading advisor with the US Commodities Futures Trading Commission, and worked in a boutique futures house in California in the 1980s.
He was a partner in one of the first futures newsletter advisory services, based in Washington DC, specialising in pork bellies and currencies. John is primarily a chart-reading trader, having cut his trading teeth in the days before PCs.
As well as his work in the financial world, he has launched, run and sold several 'real' businesses producing 'real' products.
-
 Should you buy an active ETF?
ETFs are often mischaracterised as passive products, but they can be a convenient way to add active management to your portfolio
-
 Power up your pension before 5 April – easy ways to save before the tax year end
With the end of the tax year looming, pension savers currently have a window to review and maximise what’s going into their retirement funds – we look at how