What next for the rallying gold price?
With the price of gold price having to meet his targets, John C Burford looks to see if now is a good time to set a short trade.
Get the latest financial news, insights and expert analysis from our award-winning MoneyWeek team, to help you understand what really matters when it comes to your finances.
You are now subscribed
Your newsletter sign-up was successful
Want to add more newsletters?

Twice daily
MoneyWeek
Get the latest financial news, insights and expert analysis from our award-winning MoneyWeek team, to help you understand what really matters when it comes to your finances.

Four times a week
Look After My Bills
Sign up to our free money-saving newsletter, filled with the latest news and expert advice to help you find the best tips and deals for managing your bills. Start saving today!
The last time I wrote about gold on 6 January, I had taken profits from a short trade and was looking for a decent rally from the oversold condition.
I wrote: "I have drawn in a new set of up-sloping tramlines containing the rally. The touch-points are pretty good. But now at the $1,620 area, we are approaching the Fibonacci 38% retrace of the move down from the $1,800 high, the down-sloping satellite tramline, and the upper up-sloping tramline.
"This area is marked by my 'Resistance' label in the blue box. This is formidable resistance and can be used to set another short trade."
MoneyWeek
Subscribe to MoneyWeek today and get your first six magazine issues absolutely FREE

Sign up to Money Morning
Don't miss the latest investment and personal finances news, market analysis, plus money-saving tips with our free twice-daily newsletter
Don't miss the latest investment and personal finances news, market analysis, plus money-saving tips with our free twice-daily newsletter
Since then, the market has rallied to my target area around $1,640 and now I can re-draw my short-term tramlines.
Trader tip: Keep looking for new tramline placements as trading develops, because the old ones may stop working.
I like to look first on the daily charts, then the hourly, and then the 15-minute charts. I do this several times a day in active and volatile markets.
OK, this morning, the market is trading just above the $1,640 area. Is this a good place to set a short trade?
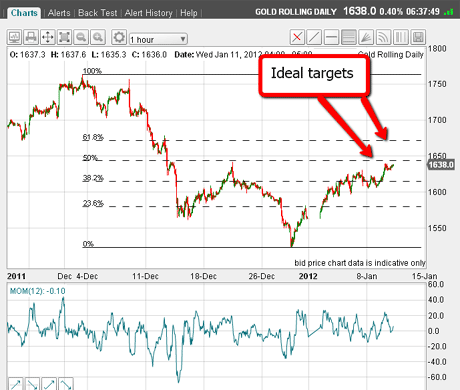
Here is the chart showing the decline off the 4 December high and the rally off the late December low:

(Click on the chart for a larger version)
I have drawn in the Fibonacci levels, and right away, I can see the market is approaching the 50% level. This is a very common retracement andwe could see a top here.
The higher level at 62% also is a common retracement area, which lies at the $1,670 level around $30 above current. I need to keep this one in mind.
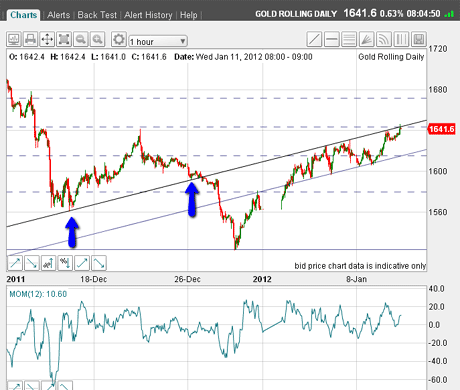
Now let's take a closer look here is the hourly chart from mid-December:

(Click on the chart for a larger version)
I have now drawn in a new pair of tramlines, which I like very much. Why? Just admire the beautiful touch-points marked by the blue arrows these points lie distant from current trading and so act as very strong anchors for the tramlines.
In other words, it would take a huge effort for the market to push up through the upper tramline. Of course, this is not impossible and the implication is if that occurs,I would likely be looking at the 61.8% retrace as my target.
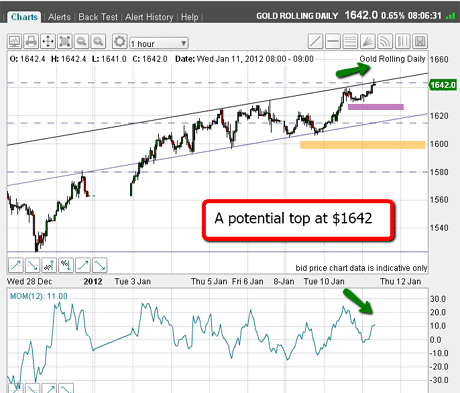
Let's now take an even closer look at recent trading:

(Click on the chart for a larger version)
As I write, the market is right up against the upper tramline in the $1,646 area (as indicated by the green arrow in the top chart). But just glance at the momentum (the green arrow on the bottom chart).
On this latest push, the momentum is lagging, and if the market decides to turn back here, that would set up a large negative momentum divergence.
The top would likely be confirmed if the market can move below the purple and yellow bars.
Of course, the market could rally further and remove this potential, but with the evidence just presented, the odds seem to favour a turn here.
There's something missing
But one thing is bothering me I cannot see a convincing A-B-C pattern to this rally. Recall, I prefer to see this pattern on counter-trend rallies and then to short on the higher C wave.
So one real possibility is that the market could turn down from here in an A wave, then dip to form a B wave, and then rally back above the A wave to make the final C wave (topping at the Fibonacci 61.8% retrace around $1,670, perhaps?).
This possibility is enhanced by the surge in bearish sentiment I have noticed towards gold recently.
This factor could well provide the ammunition to keep the rally alive a little longer.
Some answers to your queries
A couple of notes on queries sent in by readers thank you for all your emails:
1.The pip size for gold varies from spread-betting providers. I am using a pip size of $0.10 per oz, so that on a £1 per pip bet, a $10 per oz gold price move equates to £100 change in trading equity. Other providers use $0.01 as their pip, so a bet of £0.10 per pip is required to produce a £100 equity change on a gold price move of $10 per oz.
2.On a point regarding use of my 3% rule (the video will be out soon!), a reader asked about using a bigger bet size, while reducing the stop. As an example, if the 3% rule dictates that your stop is 100 pips betting £1 per pip, can you bet £2 and use a 50 pip stop? The answer is definitely not. A stop position is dictated by a sensible appraisal of the chart and the entry point. Using tighter stops inevitably leads to more frequent losses, and that is against my religion.
If you're a new reader, or need a reminder about some of the methods I refer to in my trades, then do have a look at my introductory videos:
The essentials of tramline trading
An introduction to Elliott wave theory
Advanced trading with Elliott waves
Don't miss my next trading insight. To receive all my spread betting blog posts by email, as soon as I've written them, just sign up here .
Get the latest financial news, insights and expert analysis from our award-winning MoneyWeek team, to help you understand what really matters when it comes to your finances.
John is is a British-born lapsed PhD physicist, who previously worked for Nasa on the Mars exploration team. He is a former commodity trading advisor with the US Commodities Futures Trading Commission, and worked in a boutique futures house in California in the 1980s.
He was a partner in one of the first futures newsletter advisory services, based in Washington DC, specialising in pork bellies and currencies. John is primarily a chart-reading trader, having cut his trading teeth in the days before PCs.
As well as his work in the financial world, he has launched, run and sold several 'real' businesses producing 'real' products.
-
 Average UK house price reaches £300,000 for first time, Halifax says
While the average house price has topped £300k, regional disparities still remain, Halifax finds.
-
 Barings Emerging Europe trust bounces back from Russia woes
Barings Emerging Europe trust has added the Middle East and Africa to its mandate, delivering a strong recovery, says Max King