How to spot when the market is on the turn
Spread betting expert John C Burford explains the strategies he uses to spot turns in the markets, and how you could profit from them.
Get the latest financial news, insights and expert analysis from our award-winning MoneyWeek team, to help you understand what really matters when it comes to your finances.
You are now subscribed
Your newsletter sign-up was successful
Want to add more newsletters?

Twice daily
MoneyWeek
Get the latest financial news, insights and expert analysis from our award-winning MoneyWeek team, to help you understand what really matters when it comes to your finances.

Four times a week
Look After My Bills
Sign up to our free money-saving newsletter, filled with the latest news and expert advice to help you find the best tips and deals for managing your bills. Start saving today!
Did the decline in the FTSE 100 on 28 January come as a surprise? If you had been following the stock indexes using the Elliott wave (EW) and Fibonacci principles that I use, the answer would definitely be 'No'. I'll show you why.
I'll take the FTSE as my example. The other indices I follow the Dow, S&P and Nasdaq all could have been used, and the same conclusions reached.
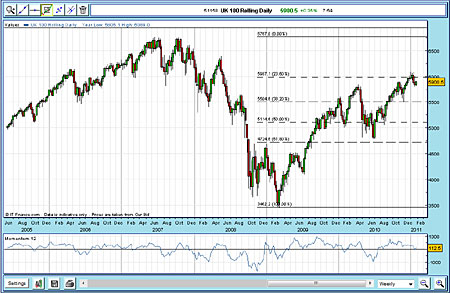
Here is the weekly chart to give us perspective:
MoneyWeek
Subscribe to MoneyWeek today and get your first six magazine issues absolutely FREE

Sign up to Money Morning
Don't miss the latest investment and personal finances news, market analysis, plus money-saving tips with our free twice-daily newsletter
Don't miss the latest investment and personal finances news, market analysis, plus money-saving tips with our free twice-daily newsletter

(Click on the chart for a larger version)
The all-time high at 6,765 was made in the summer and autumn of 2007 (showing a good double-top). This was of course, followed by the biggest bear market since the 1920s. The FTSE hit a low of 3,455 in early 2009 (on a beautiful positive divergence with momentum, please note). Since then, the FTSE has been in a strong bull market and has recently made a new high for this move.
Waves within waves
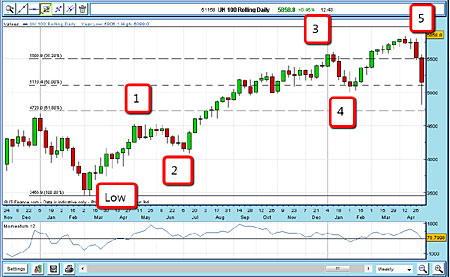
Let's have a look at this rally in more detail, because it will give us clues as to where we can make good trades. If we take the March 2009 low and make an EW count from there, we can see one wave up (wave 1), a wave 2 down, then a very strong wave 3 up, followed by a complex wave 4 down, and then a spike up into wave 5.

(Click on the chart for a larger version)
The form of this five-wave pattern obeys all the Elliott rules and guidelines indeed it's a textbook case. Why do I say that? Simply because after making wave 5 (an ending wave), the market turns tail and tumbles in a violent change of trend. This included the infamous 6 May 'Flash Crash' (when the Dow Jones toppled by more than 1,000 points at one point).
This action confirmed my EW count as far as it went. In fact, trading off the April 2010 high would have been very profitable in a short space of time. But that may not be the whole story for the rally off the 3,455 low. We always need to keep in mind the possibility that we may have made a correct count, but it may be a part of a larger wave pattern. One clue that this may be about to happen here is that the April rally to 5,850 took the market to a point between the Fibonacci 61.8% and the 76.4% levels in other words, the market was in no-man's land. A top at a Fibonacci level would have been much more convincing.
After five waves, can the market recover to new highs?
The collapse in May to the 4,800 area was traumatic or exciting if you were short! During these turbulent times, it paid to be a very short-term trader. When the market made its low in July, it started to rally again. This was around the time when Ben Bernanke made his announcement that we'd see another batch of quantitative easing (QEII).
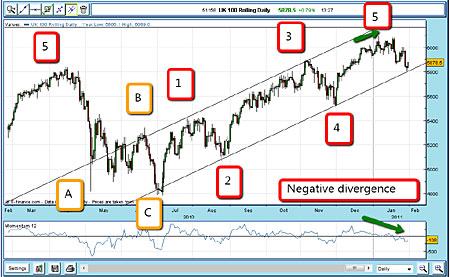
Many bears including me believed the rally would be short-lived. But in fact the market rallied off each dip, as is shown clearly in the daily chart below:

(Click on the chart for a larger version)
As the market rallied, I could then label the three-wave correction A-B-C (in yellow). Before that, the count was not clear.
Then the rally from July showed clear tramline trading features. At the November high, I could draw my tramlines. This now gave me a target area for the next dip, as I projected the lower tramline into 2011.
Back to the drawing board
By November, I knew this rally was not simply a bear market rally, as a new high above the April high had been made. In other words, I had to change my EW ideas! But I was still looking for a possible final high and I went back to my weekly chart.
In early January, the market was heading for the Fibonacci 76.4% retrace at the 6,000 level. We know that round-number levels are very often targets and can repel further advances, at least temporarily. That suggested that I should be looking for a top around the 6,000 level.
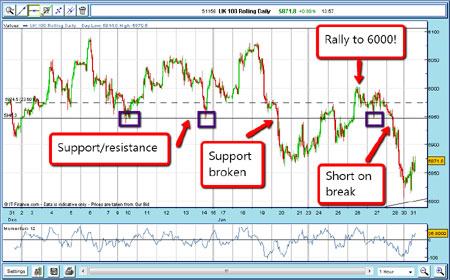
And in January, the market did make it and traded around that level for a few days. So I then applied my hourly chart to try to pin-point an entry, and this is what I found:

(Click on the chart for a larger version)
After trading above 6,000, the market broke down through my support/resistance line. That was the first clue to expect a change in trend. On 20 January, the market made another attempt to rally, and made it back to the exact 6,000 level on 26 January.
Then, the break through my support line on 27 January was all I needed to short the market. I knew where my target was from November near the lower tramline (you can just see the bottom tramline in the bottom right-hand corner of the chart above). That was a possible 140 pip trade.
So that was a trade based on the use of EW and Fibonacci, with help from momentum divergences. The drop on 28 January was not a surprise, as the EW count had indicated that a top was imminent.
NB: Don't miss my next bit of trading advice. To receive all my spread betting blog posts by email, as soon as I've written them, just sign up here .
Get the latest financial news, insights and expert analysis from our award-winning MoneyWeek team, to help you understand what really matters when it comes to your finances.
John is is a British-born lapsed PhD physicist, who previously worked for Nasa on the Mars exploration team. He is a former commodity trading advisor with the US Commodities Futures Trading Commission, and worked in a boutique futures house in California in the 1980s.
He was a partner in one of the first futures newsletter advisory services, based in Washington DC, specialising in pork bellies and currencies. John is primarily a chart-reading trader, having cut his trading teeth in the days before PCs.
As well as his work in the financial world, he has launched, run and sold several 'real' businesses producing 'real' products.
-
 Should you buy an active ETF?
ETFs are often mischaracterised as passive products, but they can be a convenient way to add active management to your portfolio
-
 Power up your pension before 5 April – easy ways to save before the tax year end
With the end of the tax year looming, pension savers currently have a window to review and maximise what’s going into their retirement funds – we look at how