How the silver market can help with trading gold
John C Burford explains how keeping a close eye on silver can help spread betters find profits when trading the gold market.
Get the latest financial news, insights and expert analysis from our award-winning MoneyWeek team, to help you understand what really matters when it comes to your finances.
You are now subscribed
Your newsletter sign-up was successful
Want to add more newsletters?

Twice daily
MoneyWeek
Get the latest financial news, insights and expert analysis from our award-winning MoneyWeek team, to help you understand what really matters when it comes to your finances.

Four times a week
Look After My Bills
Sign up to our free money-saving newsletter, filled with the latest news and expert advice to help you find the best tips and deals for managing your bills. Start saving today!
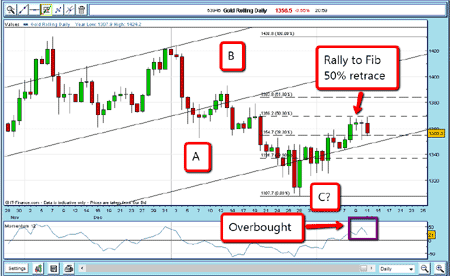
In my last piece which was about using my tramline trading methods to trade the gold market I left off what happens to a price suspended in mid-tramline. After strong gyrations for some months, the market was hovering around my fourth tramline, as you can see in the chart below:

(Click image for a larger version)
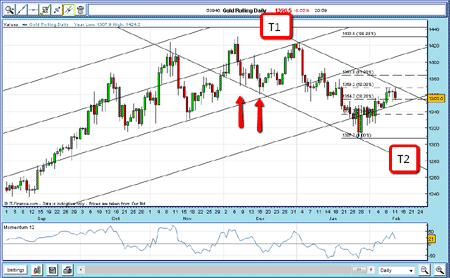
But with substantial trading having occurred from the three highs made at the $1,420 level between November and 1 January, I am now able to draw another pair of tramlines; this time, sloping down. Here is the latest chart:
MoneyWeek
Subscribe to MoneyWeek today and get your first six magazine issues absolutely FREE

Sign up to Money Morning
Don't miss the latest investment and personal finances news, market analysis, plus money-saving tips with our free twice-daily newsletter
Don't miss the latest investment and personal finances news, market analysis, plus money-saving tips with our free twice-daily newsletter

If I take the high at the Fibonacci 50% retrace as one point and draw a potential tramline (T1) through the 1 January high, the result is shown. Remember, two points are all I need to make a tramline. If further points are found to lie on that line, it solidifies its validity (a good example is in my last gold email: Why gold is a great market for tramline trading).

Claim your FREE report: The 6-step game-plan for
spread betting profits
Now, using my parallel line tool, I look for a good place to put my second tramline and already, I have a good candidate (T2). It passes through the significant $1,307 low and passes near the 9 November spike top. It's not perfect, but it's acceptable. And what makes it even more so is that it passes through the two minor lows (marked with red arrows on the chart). At these points, this line acted as good support, thus validating my line placement.
But now, with gold having rallied to the Fibonacci 50% retrace level on an overbought momentum reading, odds are that the market may well drop from here, or at least consolidate to work off the momentum excess.
What silver tells us about gold
How can I get a better idea of whether my hunch is correct? One option is to look at the silver market.
Silver prices have a significant correlation to the gold market, but not perfect. For one thing, silver is primarily an industrial metal the coinage and bullion sector is small, unlike gold. Silver prices tend to follow the world economy: rising when GDP rises, and vice versa. Recently, gold prices have also risen along with world GDP, and the two have now become highly correlated.
But the silver futures market is small compared with gold. On the Comex (the largest futures market for gold and silver), the number of gold contracts outstanding is around 400,000, while for silver it is 85,000. Also, while price movements tend to be somewhat 'spiky' for both markets, this is all the more so for silver. This means that we get many 'tails' on our candlestick charts, which are price moves that are quickly retraced, often in a matter of minutes.
This means that if we use close protective stops, we can be 'whipsawed' as they are taken out, only for the market to resume moving in our direction. This is very frustrating, as I know from personal experience! As a result, the best way to play silver is to identify a possible turning point, using methods such as the one I'll describe here, and then place a wide-ish stop. That will often be determined by the size my account, particularly when following my 3% rule. Thus, we often see price 'overshoots' of our tramlines in all time frames (see the many examples in the charts of my previous gold article).
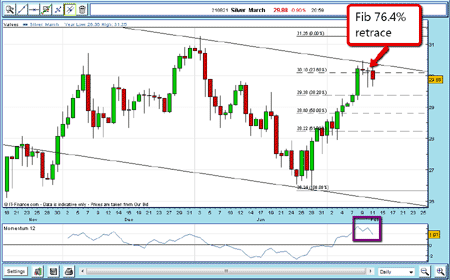
So what does the silver market tell me about gold? Here is the equivalent chart:

The market has tracked gold upwards, but the rally has been stronger, having reached the Fibonacci 76.4% retrace level (only 50% in gold), and on very overbought momentum.
So the odds now favour a decline in silver. Of course, I have a natural stop-loss point for a short sale: just above the upper tramline.
That would have represented a good reward/risk ratio trade.
I shall be closely following these markets and will offer more tramline trading examples as they arise.
Oh, and just before I go if you'd like to learn more about these techniques, I'll be doing a workshop session at The London Traders Expo on 8-9 April 2011, at the Queen Elizabeth II Conference Centre. Whether you're an experienced trader or just starting out, the exhibition gives you the chance to meet industry experts, test out the latest products and software, and pick up trading ideas and strategies. You can register here for free.
NB: Don't miss my next bit of trading advice. To receive all my spread betting blog posts by email, as soon as I've written them, just sign up here .
Get the latest financial news, insights and expert analysis from our award-winning MoneyWeek team, to help you understand what really matters when it comes to your finances.
John is is a British-born lapsed PhD physicist, who previously worked for Nasa on the Mars exploration team. He is a former commodity trading advisor with the US Commodities Futures Trading Commission, and worked in a boutique futures house in California in the 1980s.
He was a partner in one of the first futures newsletter advisory services, based in Washington DC, specialising in pork bellies and currencies. John is primarily a chart-reading trader, having cut his trading teeth in the days before PCs.
As well as his work in the financial world, he has launched, run and sold several 'real' businesses producing 'real' products.
-
 Average UK house price reaches £300,000 for first time, Halifax says
While the average house price has topped £300k, regional disparities still remain, Halifax finds.
-
 Barings Emerging Europe trust bounces back from Russia woes
Barings Emerging Europe trust has added the Middle East and Africa to its mandate, delivering a strong recovery, says Max King