Has gold's rally finally topped out?
John C Burford looks for evidence that gold is starting to move back down.
Get the latest financial news, insights and expert analysis from our award-winning MoneyWeek team, to help you understand what really matters when it comes to your finances.
You are now subscribed
Your newsletter sign-up was successful
Want to add more newsletters?

Twice daily
MoneyWeek
Get the latest financial news, insights and expert analysis from our award-winning MoneyWeek team, to help you understand what really matters when it comes to your finances.

Four times a week
Look After My Bills
Sign up to our free money-saving newsletter, filled with the latest news and expert advice to help you find the best tips and deals for managing your bills. Start saving today!
When I last covered gold on 31 October, I noted the big decline off the 28 October high and suggested that the relief rally was finally done.
I was somewhat premature, as the market yesterday moved up to the $1,800 an ounce level a new rally high and only $120 off the all-time high made on 6 September.
But right after I wrote that article, the market continued its decline to produce a drop of $80 off the high before finding a low and then continuing its rally.
MoneyWeek
Subscribe to MoneyWeek today and get your first six magazine issues absolutely FREE

Sign up to Money Morning
Don't miss the latest investment and personal finances news, market analysis, plus money-saving tips with our free twice-daily newsletter
Don't miss the latest investment and personal finances news, market analysis, plus money-saving tips with our free twice-daily newsletter
My idea that gold made a double top in the $1,920 area and is now beginning a bear market is being severely challenged. But I am still hanging in there, and today I present evidence that gold is starting to move back down.
I hope to be vindicated!
Is gold heading for a reversal?
Let's take a look at the bigger picture before zooming in on the fine structure.
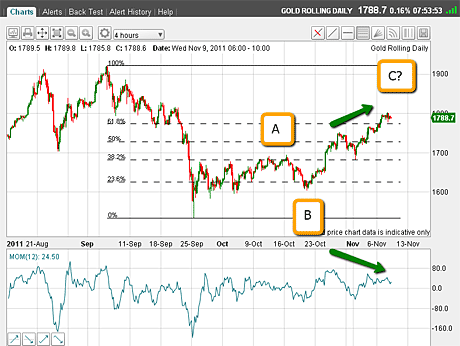
Here is the four-hour chart showing my double top:

(Click on the chart for a bigger version)
From the plunge low in September (where the market hits the 0% line in the chart above), the rally has been a very choppy affair, which suggests a counter-trend move.
The waves are all overlapping, and I can count a clear A-B-C pattern, which is counter-trend (for more on Elliott waves, see my video: An introduction to Elliott wave theory).
Note that momentum is weakening into the C-wave high (marked by my green arrows), thus producing a potential negative momentum divergence.
This tells me that the rally is a weak one and to expect a reversal at any time.
Also, the C wave has carried to just above the 62% Fibonacci retrace a typical reversal point.
I go hunting for a mammoth trade
OK, so I am building a picture here that suggests a reversal is coming up.
Of course, at this early stage, I cannot say whether this potential decline will be a large one, or if it will resemble the $80 dip mentioned above.
In trading, we have to 'play it by ear' somewhat and observe the patterns that develop over time. But using a little Elliott wave theory in advance can give us a rough road map against which we can compare market moves. It has certainly helped me greatly.
So, looking ahead a little, if the September plunge low is a downward Elliott wave 1, and the wave C marked in the above chart is a wave 2, then I can expect a wave 3 down, which should be very large.
That means my quest for a top here could well produce a mammoth trade. That is why I am keenly focusing in on it!
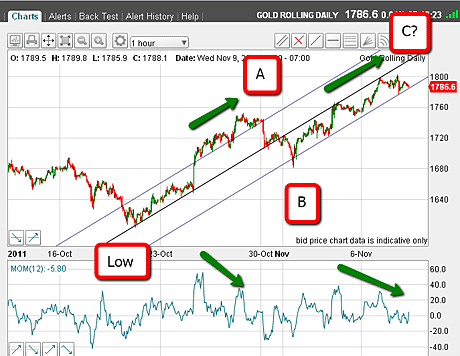
OK, let's zoom in on the smaller picture. Here is the hourly chart:

(Click on the chart for a bigger version)
The low marked corresponds to wave B in the first chart, and the red wave C is the wave C in the first chart. Again, we see a clear A-B-C pattern.
I have also drawn in my tramline trio. The central tramline has several excellent touch-points and I consider this very reliable.
The market is currently challenging my lower tramline. Breaking this tramline will be significant, I believe.
What is interesting is the repeated patterns of negative momentum divergences as marked by my green arrows. This shows the weakening of the rally.
What would point to a lower gold price?
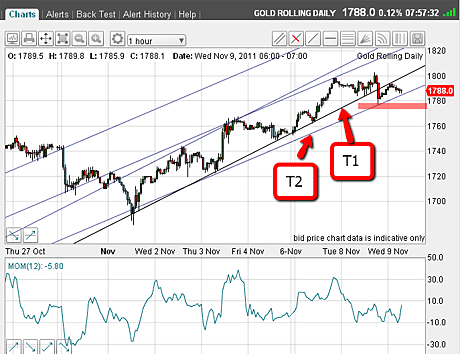
OK, let's focus in even further, on the latest wave wave C (red):

(Click on the chart for a bigger version)
The rally from last Wednesday can be contained within a new pair of tramlines, and the relevant one is marked T1. They match quite closely the "original" tramlines, the lower of which I have marked T2.
Already, the market has moved below T1, has bounced to kiss its underside. It is currently moving down in a 'scalded cat bounce' to challenge T2.
So it appears that the market wants to move down and if it can break below T2, that would confirm it for me.
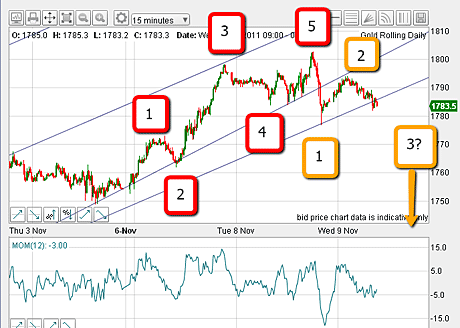
Here is even more evidence that the top is in:

(Click on the chart for a bigger version)
This is the 15-minute chart and shows the latest rally surge. This sports a clear five-wave pattern complete with a strong wave 3 then the plunge off the $1,800 wave 5 top to break T1 (wave 1? marked in yellow), and then the T1 kiss (wave 2? in yellow again).
Remember, fifth waves are ending waves.
If my theory is correct, we have started wave 3 down (marked in yellow), which should draw prices way below wave 1.
The evidence is certainly mounting up to support my topping thesis.
So, how to play it? The obvious trade is to place sell-stops below the support as marked by the pink bar on chart 3 (which I've reprinted below), or alternatively, place the entry sell orders just below T2.

(Click on the chart for a bigger version)
Of course, entering at the pink bar entails the risk of the market rallying back to the underside of T2, which occurred with the T1 break. You would then be sitting on an initial loss, which may exceed your 3% risk.
These are the kinds of difficult decisions all traders have to make. But whatever risk you decide to take on, having a solid money management strategy in place is vital. I cannot stress this often enough.
If you're a new reader, or need a reminder about some of the methods I refer to in my trades, then do have a look at my introductory videos:
The essentials of tramline trading
An introduction to Elliott wave theory
And Iam preparing a new video tutorial on my 3% rule watch out for it!
Don't miss my next trading insight. To receive all my spread betting blog posts by email, as soon as I've written them, just sign up here .
Get the latest financial news, insights and expert analysis from our award-winning MoneyWeek team, to help you understand what really matters when it comes to your finances.
John is is a British-born lapsed PhD physicist, who previously worked for Nasa on the Mars exploration team. He is a former commodity trading advisor with the US Commodities Futures Trading Commission, and worked in a boutique futures house in California in the 1980s.
He was a partner in one of the first futures newsletter advisory services, based in Washington DC, specialising in pork bellies and currencies. John is primarily a chart-reading trader, having cut his trading teeth in the days before PCs.
As well as his work in the financial world, he has launched, run and sold several 'real' businesses producing 'real' products.
-
 How a ‘great view’ from your home can boost its value by 35%
A house that comes with a picturesque backdrop could add tens of thousands of pounds to its asking price – but how does each region compare?
-
 What is a care fees annuity and how much does it cost?
How we will be cared for in our later years – and how much we are willing to pay for it – are conversations best had as early as possible. One option to cover the cost is a care fees annuity. We look at the pros and cons.