Trading a 'crossroads' in the euro/sterling exchange rate
Currency trading charts are painting a startling picture in the euro vs sterling rate, says John C Burford. Here's how to play it.
Get the latest financial news, insights and expert analysis from our award-winning MoneyWeek team, to help you understand what really matters when it comes to your finances.
You are now subscribed
Your newsletter sign-up was successful
Want to add more newsletters?

Twice daily
MoneyWeek
Get the latest financial news, insights and expert analysis from our award-winning MoneyWeek team, to help you understand what really matters when it comes to your finances.

Four times a week
Look After My Bills
Sign up to our free money-saving newsletter, filled with the latest news and expert advice to help you find the best tips and deals for managing your bills. Start saving today!
The euro vs sterling (EUR/GBP) rate is dear to the hearts of many UK and European residents and spread betters.
Now is a good time to look at the technical backdrop, since the charts are painting a startling picture. Let me explain.
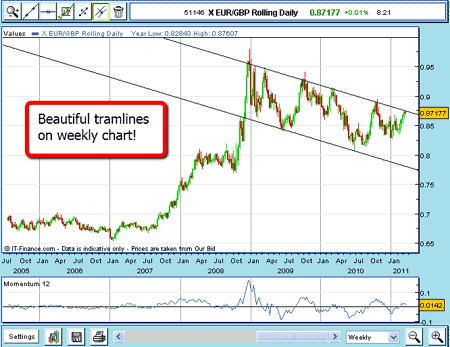
When I look at a market afresh, I like to check first on the long-term weekly chart
MoneyWeek
Subscribe to MoneyWeek today and get your first six magazine issues absolutely FREE

Sign up to Money Morning
Don't miss the latest investment and personal finances news, market analysis, plus money-saving tips with our free twice-daily newsletter
Don't miss the latest investment and personal finances news, market analysis, plus money-saving tips with our free twice-daily newsletter
The market was moving up in 2000 2007, and the euro then surged in a strong rally to peak in December 2008 at the £0.98 level. The universal cry at the time was for parity for the euro and beyond!
But following the age-old rule, "the markets exist to punish the majority", the market plunged in 2009, then embarked on a choppy retracement exercise.
This retracement has been contained within my tramlines, as shown in the chart above.
We had one 'overshoot' in October 2009. But all of the major highs and lows have been marked out by the tramlines.
This is classic tramline behaviour.
(Click on the chart for a larger version)
Taking a closer look at the charts
This is one of the characteristics of retracements they occur in overlapping waves and the highs and lows are contained between parallel tramlines.
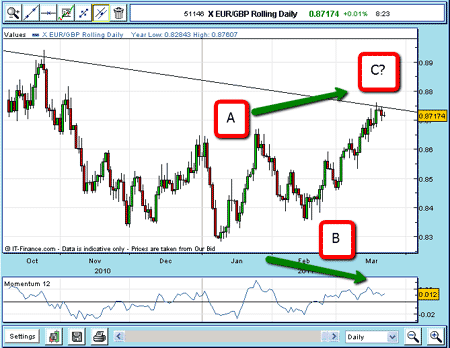
So far, so good. Let's now take a closer look. Here is the daily chart going back to last October:
(Click on the chart for a larger version)
From the January low, the rally has occurred in three waves A-B-C, which is corrective.
Note that my tentative wave C label lies right on the upper weekly tramline. This area represents significant resistance to further advances.
And note the negative divergence with momentum, which often foretells of a top.
But here is the interesting bit waves A and C are of equal length in price! This is a very frequent wave relationship in A-B-C retracements. That gives me confidence that my wave C label has some validity.

Claim your FREE report: The 6-step game-plan for
spread betting profits
But here is the interesting bit waves A and C are of equal length in price! This is a very frequent wave relationship in A-B-C retracements. That gives me confidence that my wave C label has some validity.
Waves within waves
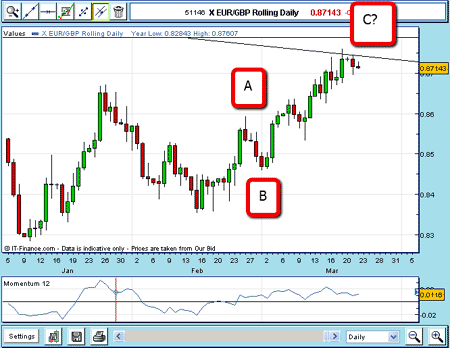
OK, let's have an even closer look. Here is the daily chart which shows wave C is itself a three-wave affair:
(Click on the chart for a larger version)
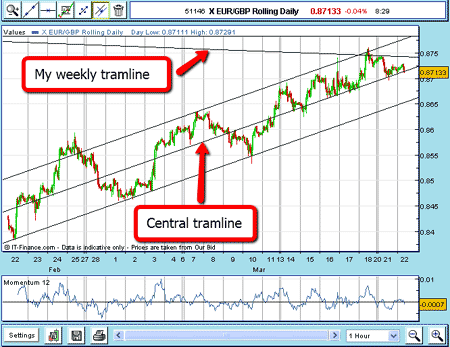
Now let's focus on the hourly chart for the past few days:
(Click on the chart for a larger version)
Trading is being contained between my tramlines (except for the odd overthrow). But look at my central tramline it has contained many of the minor highs and lows and the market is resting right on it, having hit the weekly tramline two days ago. Let's have a closer look:
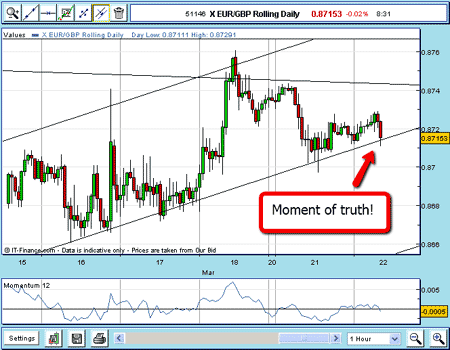
(Click on the chart for a larger version)
The market lies right on my central tramline and if my outer tramlines are still operating, there is a likelihood that the market can move down to the lower line.
The fundamentals are of little use in trading
Taking you through this analysis, I hope I have given you an idea of the process I use to guide me in making my trading decisions.
Note that I rarely refer to 'fundamental' factors, except in the broadest way.
As I have noted before, in the words of Joe Granville, "When the fundamentals seem obvious, they are obviously wrong" (from a trading standpoint!).
NB: Don't miss my next bit of trading advice. To receive all my spread betting blog posts by email, as soon as I've written them, just sign up here .
Get the latest financial news, insights and expert analysis from our award-winning MoneyWeek team, to help you understand what really matters when it comes to your finances.
John is is a British-born lapsed PhD physicist, who previously worked for Nasa on the Mars exploration team. He is a former commodity trading advisor with the US Commodities Futures Trading Commission, and worked in a boutique futures house in California in the 1980s.
He was a partner in one of the first futures newsletter advisory services, based in Washington DC, specialising in pork bellies and currencies. John is primarily a chart-reading trader, having cut his trading teeth in the days before PCs.
As well as his work in the financial world, he has launched, run and sold several 'real' businesses producing 'real' products.
-
 UK interest rates live: experts expect MPC to hold rates
The Bank of England’s Monetary Policy Committee (MPC) meets today to decide UK interest rates. The last meeting resulted in a cut, but experts think there is little chance of interest rates falling today.
-
 MoneyWeek Talks: The funds to choose in 2026
Podcast Fidelity's Tom Stevenson reveals his top three funds for 2026 for your ISA or self-invested personal pension