Spotting a turning point in the currency markets
John C Burford demonstrates how to spot a turning point in the currency markets, as a 'wedge' forms in the dollar/yen.
Get the latest financial news, insights and expert analysis from our award-winning MoneyWeek team, to help you understand what really matters when it comes to your finances.
You are now subscribed
Your newsletter sign-up was successful
Want to add more newsletters?

Twice daily
MoneyWeek
Get the latest financial news, insights and expert analysis from our award-winning MoneyWeek team, to help you understand what really matters when it comes to your finances.

Four times a week
Look After My Bills
Sign up to our free money-saving newsletter, filled with the latest news and expert advice to help you find the best tips and deals for managing your bills. Start saving today!
In a previous post, I showed a trade in the US dollar/yen (USD/JY) cross. The yen has benefited from the large 'carry trade', since interest rates in Japan have been ultra-low for some time, as the government has attempted to induce some inflation into the economy (and failed). On the other side of the cross, the dollar has been weakened by Fed money-printing policies.
So far, so understandable.
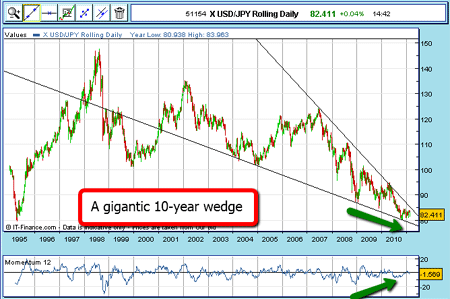
But at some point, the market will discount all the 'bad' news and will then embark on a counter-trend rally. Our job as traders is to identify these turning points. Below is the long-range chart showing the market in the process of building a gigantic wedge formation on the weekly chart:
MoneyWeek
Subscribe to MoneyWeek today and get your first six magazine issues absolutely FREE

Sign up to Money Morning
Don't miss the latest investment and personal finances news, market analysis, plus money-saving tips with our free twice-daily newsletter
Don't miss the latest investment and personal finances news, market analysis, plus money-saving tips with our free twice-daily newsletter
Identifying the turning point
The edges of the wedge define the extremes (highs and lows) of trading for almost four years. Classical charting says that when the market finally moves out of the wedge formation, the move will normally be powerful. We are not far away from that point!

(Click on the chart for a larger version)
If you are interested in studying wedges and the other classical chart formations and what they can tell us, get a copy of Technical Analysis of Stock Trends by Edwards and Magee. Although originally published in the 1940s, it remains the 'bible' of tech analysis. The latest edition is, I believe, the 2001 edition.

Claim your FREE report: The 6-step game-plan for
spread betting profits
But look at the large positive divergence with momentum at the recent 80 low. That is a sign the downtrend is losing steam. Also, the 80 level is a long-term support level (only reached this low in 1995). So, I am looking for a bottom from which to trade on the long side, expecting a sizeable move.
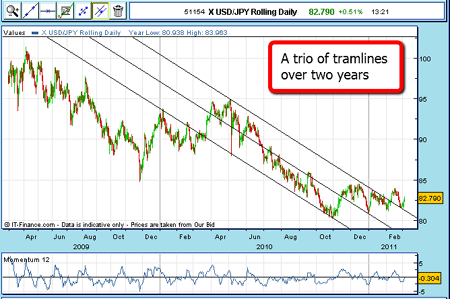
Let's have a closer look at trading over the past year on a daily chart:

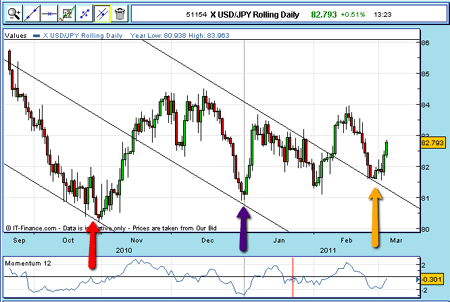
The market has moved down to the 80 area in a series of waves, contained between my two outer tramlines. Now take a look at my middle tramline. It touches many highs and lows and just look at how recent trading has bounced off this central line. Here it is blown up:

We're moving into a significant area of the market
There was a bounce up from the lower tramline in October/November (red arrow), another bounce off the centre tramline in December/January (blue arrow), and yet another bounce off the upper tramline in March (yellow arrow).
Remember, I drew my tramlines well before these points had been put in. I like to think of the tramlines as mirrors that bounce the market (until, of course, the market crashes right through).
Any of these three points could have been used to take long trades with natural places to put protective stops (just at the other side of the tramlines).
As I write, the market is rallying towards the upper boundary of my wedge (in the 84-85 area). It may or may not make it on this attempt. But note the previous highs made last December in this region. The market evidently believes this area to be significant, and there was previously strong resistance to rallies.
If the market can reach 84-85 again, there should be a great many stops which the shorts placed there to protect their positions, and that means only one thing a big short-covering rally.
Meanwhile, most traders will be short-term trading for the swings, and very long-term traders will be accumulating long positions looking for a multi-month and multi-year rally, hoping the 80 level acts once again as solid support.
NB: Don't miss my next bit of trading advice. To receive all my spread betting blog posts by email, as soon as I've written them, just sign up here .
Get the latest financial news, insights and expert analysis from our award-winning MoneyWeek team, to help you understand what really matters when it comes to your finances.
John is is a British-born lapsed PhD physicist, who previously worked for Nasa on the Mars exploration team. He is a former commodity trading advisor with the US Commodities Futures Trading Commission, and worked in a boutique futures house in California in the 1980s.
He was a partner in one of the first futures newsletter advisory services, based in Washington DC, specialising in pork bellies and currencies. John is primarily a chart-reading trader, having cut his trading teeth in the days before PCs.
As well as his work in the financial world, he has launched, run and sold several 'real' businesses producing 'real' products.
-
 Average UK house price reaches £300,000 for first time, Halifax says
While the average house price has topped £300k, regional disparities still remain, Halifax finds.
-
 Barings Emerging Europe trust bounces back from Russia woes
Barings Emerging Europe trust has added the Middle East and Africa to its mandate, delivering a strong recovery, says Max King