Petrol isn’t at £1 a litre just yet – but it's possible
Petrol under a quid? John C Burford uses his chart-trading methods to show why he wouldn't rule it out.
Get the latest financial news, insights and expert analysis from our award-winning MoneyWeek team, to help you understand what really matters when it comes to your finances.
You are now subscribed
Your newsletter sign-up was successful
Want to add more newsletters?

Twice daily
MoneyWeek
Get the latest financial news, insights and expert analysis from our award-winning MoneyWeek team, to help you understand what really matters when it comes to your finances.

Four times a week
Look After My Bills
Sign up to our free money-saving newsletter, filled with the latest news and expert advice to help you find the best tips and deals for managing your bills. Start saving today!
Did you wake up this morning, surprised that crude oil had 'suddenly' rallied by almost $4? Where did that come from? If you have been following the media, where headlines have confidently been predicting that petrol was heading for wait for it £1 a litre, it would have come as a bit of a shock.
But yet again, my headline indicator kicked in (and made that price very unlikely)!
Here are some of the recent headlines:
MoneyWeek
Subscribe to MoneyWeek today and get your first six magazine issues absolutely FREE

Sign up to Money Morning
Don't miss the latest investment and personal finances news, market analysis, plus money-saving tips with our free twice-daily newsletter
Don't miss the latest investment and personal finances news, market analysis, plus money-saving tips with our free twice-daily newsletter
Change from a quid? Petrol price war intensifies (Guardian and Daily Mail)
Motorists boosted by further cuts to price of petrol (AOL online)
But wait - here are some headlines from late last year when the crude oil market was similarly in a steep decline:
Petrol for a quid if oil price slump deepens (Telegraph)
Petrol prices could drop to less than £1 a litre. (Plymouth Herald)
Petrol set to fall to £1 a litre for first time in seven years (Daily Record)
OK, so did petrol drop to £1 a litre last winter? Maybe it did in Venezuela, but not here.
Actually, you can buy petrolfor $0.002 a gallon in Caracas, according to Bloomberg. So a quid would buy you 750 gallons, or get you and your car a distance over 20,000 miles without re-filling almost once around the equator! Not bad, if you wanted to drive that journey.
So this week, my headline indicator kicked in and flashed red alert.
But I did warn regular readers to expect a surge in commodity prices.
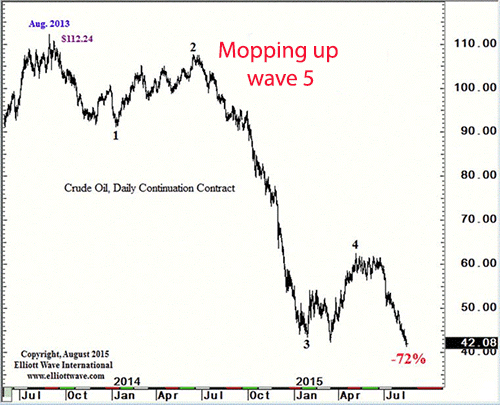
In my postof 17 August "My money is on a big commodity rebound here's why" I laid out my case for such a reversal based on the Elliott wave picture. Below is the chart of crude oil going back to last year. As I pointed out, the stand-out feature is the massive plunge last year which is clearly a third wave of a five wave sequence. The rally to the $60 region into the Spring this year is a wave 4 and the recent decline is the final fifth wave.

(Chart courtesy www.elliottwave.com)
I wanted to find out when the fifth wave would end. That was my challenge as I stalked the major low, looking to cover my shorts and go long.
This is what I wrote last time:"But for a trader, the key observation of the price chart is that the market has now declined to levels below the wave 3 low and is thus in the final wave 5. That means that the entire five down could reverse at any time."
You often read pundits who claim that picking bottoms and tops is a mug's game. They say that it is impossible to do and the only strategy that makes sense is to follow the trend. Well, if that makes me a mug, sign me up. I have built my reputation on picking major market turns and this one in crude was not going to elude me.
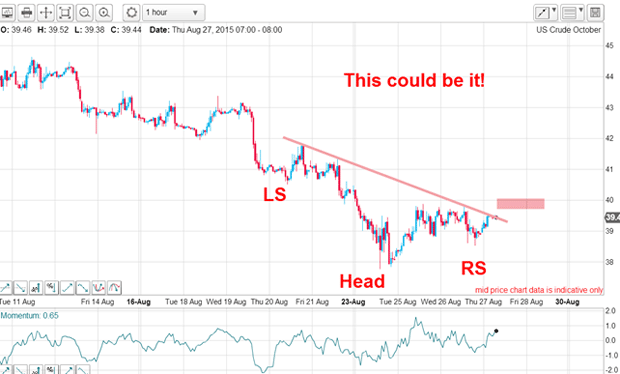
Yesterday morning in US crude, a head and shoulders reversal looked to be taking place but only if the market could surge above my neckline (the tan line). A genuine head and shoulders pattern is a very powerful trend reversal signal. But many chartists use it incorrectly. To be genuine, it must appear after a hard trending market and the crude market certainly qualifies.

So yesterday, I was poised with my resting buy stops in the $40 area to exit short positions and reverse and take new long ones in the pink zone. And what a good decision that was! The market exploded and this is the picture this morning:

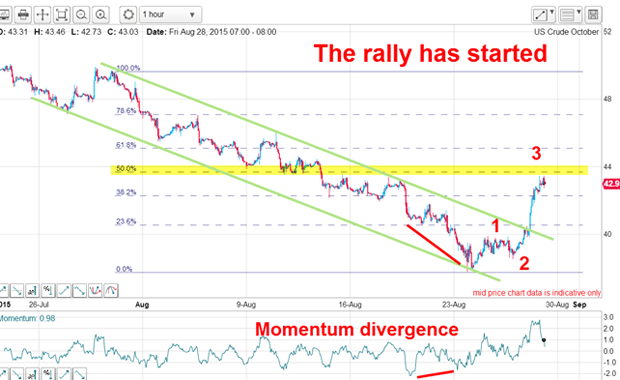
I have a lovely tramline pair working and the market just burst up past the upper tramline on its way to the current $43 print. Note the large momentum divergence going into the $39 low a clear warning that the downtrend was in jeopardy.
The rally off the $39 low is in a clear 1-2-3 with a long and strong (high momentum reading) wave 3, which may not have ended just yet. Resistance appears just up ahead at the Fibonacci 50% level (yellow highlight) where a dip in wave 4 could emerge, leading to new highs in wave 5. And if that fifth wave appears, it could confirm the major trend is now firmly up.
So if the counter-trend rally is truly under way, what is my target? This is what I wrote in my 17 August post: "Many counter-trend moves do make it to the previous wave 4 extreme at the very least, and often much further. That would place a target at the $60 area and would be my best guess for a first goal."
And I still stand by that target which I set many days ago.
Petrol under a quid? It is possible because the supermarkets are engaged in ferocious competition, and they may have hedged near the $40 area, which is lower than the level reached last winter. If I were a major retailer of fuel, I would be over-hedged now.
Get the latest financial news, insights and expert analysis from our award-winning MoneyWeek team, to help you understand what really matters when it comes to your finances.
John is is a British-born lapsed PhD physicist, who previously worked for Nasa on the Mars exploration team. He is a former commodity trading advisor with the US Commodities Futures Trading Commission, and worked in a boutique futures house in California in the 1980s.
He was a partner in one of the first futures newsletter advisory services, based in Washington DC, specialising in pork bellies and currencies. John is primarily a chart-reading trader, having cut his trading teeth in the days before PCs.
As well as his work in the financial world, he has launched, run and sold several 'real' businesses producing 'real' products.
-
 Average UK house price reaches £300,000 for first time, Halifax says
While the average house price has topped £300k, regional disparities still remain, Halifax finds.
-
 Barings Emerging Europe trust bounces back from Russia woes
Barings Emerging Europe trust has added the Middle East and Africa to its mandate, delivering a strong recovery, says Max King