My money is on a big commodities rebound – here’s why
Commodities traders are too busy looking at the headlines, says John C Burford. Smart traders are looking at the charts.
Get the latest financial news, insights and expert analysis from our award-winning MoneyWeek team, to help you understand what really matters when it comes to your finances.
You are now subscribed
Your newsletter sign-up was successful
Want to add more newsletters?

Twice daily
MoneyWeek
Get the latest financial news, insights and expert analysis from our award-winning MoneyWeek team, to help you understand what really matters when it comes to your finances.

Four times a week
Look After My Bills
Sign up to our free money-saving newsletter, filled with the latest news and expert advice to help you find the best tips and deals for managing your bills. Start saving today!
The commodity sector is in the doldrums. Surely, everyone now accepts that as a given with all of the negative coverage it has received recently. We've become used to seeing almost daily headlines proclaiming record low prices in commodities from iron ore to crude oil, to base metals and UK milk. And these stories are now frequently appearing in the media.
As you know, I generally follow the rule that when a particular story moves from the specialist research departments to appearing regularly in the media, that story is about finished. That is the basis I am working on with commodities.
Also, in the rather more professional forum at the seeking alpha site, the commodity section is attracting only a handful of articles.
MoneyWeek
Subscribe to MoneyWeek today and get your first six magazine issues absolutely FREE

Sign up to Money Morning
Don't miss the latest investment and personal finances news, market analysis, plus money-saving tips with our free twice-daily newsletter
Don't miss the latest investment and personal finances news, market analysis, plus money-saving tips with our free twice-daily newsletter
When a sector has been in a bear trend for some time, the number of articles invariably dries up. Is that because most people are only interested in bull markets? Do most people fear short selling as a strategy for profit?
Crude oil looks set to bounce back to about $60
The pillar of the commodity complex is crude oil, of course. And this market has been getting more than its fair share of negative press in recent weeks. So today I want to examine the case for a possible turn-around in this market.
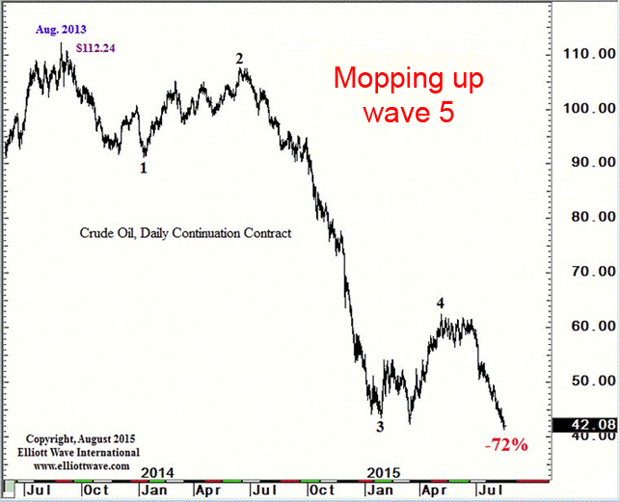
Here is the daily chart of US crude. From the $112 high exactly two years ago, the market has been in decline. But the steepest decline occurred between June last year to the January low. This has all the hallmarks of a third wave.

(Chart courtesy www.elliottwave.com)
It came at a time when many pundits were calling for prices to remain above $100, based on the assumption that Saudi Arabia the traditional swing producer would cut its production as it had in the past to maintain that floor. That was because US shale production was starting to flow and stockpiles were starting to build.
But a funny thing happened on the way to that $100 floor. Saudi Arabia did not cut production and instead seemed to engage in a price war with the US frackers, with their much higher costs, to drive them out of business.
That realisation slowly pervaded the market and the oil bulls were forced to liquidate positions in the massive wave 3 decline.
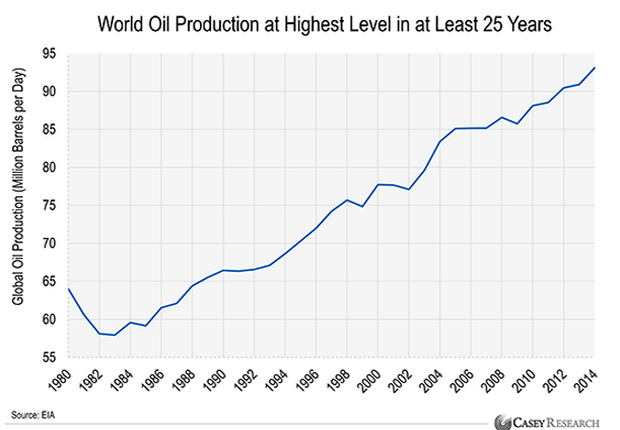
Meanwhile, production has been increasing as shown in this chart:

With production still rising, how can crude prices stage a rebound? That is the question asked by most investors. But it is the wrong one to ask. Prices are moved by sentiment, not by hard data. The correct question is this: if crude oil rallies, how will this affect production?
In fact, production levels have little bearing on the market. Otherwise, how could production have risen so sharply for decades until 2013 while prices rocketed?
But for a trader, the key observation of the price chart is that the market has now declined to levels below the wave 3 low and is thus in the final wave 5. That means that the entire five down could reverse at any time.
If it does, then what would a 'normal' rally look like? Many counter-trend moves do make it to the previous wave 4 extreme at the very least, and often much further. That would place a target at the $60 area and would be my best guess for a first goal.
This chart suggests that copper could rally at any time
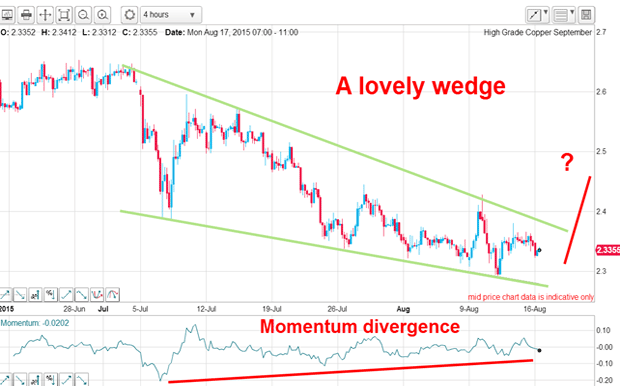
Dr Copper the metal with the PhD has also been in severe decline with prices making multi-year lows. The latest leg down has been forming a declining wedge pattern (declining because both wedge line are pointing down). But there is a looming momentum divergence, indicating selling pressure is drying up. A break of the upper line would then point to the start of a rally phase:

Here is the latest commitments of traders (COT) data showing the specs are net short:
| (Contracts of 25,000 pounds) | Row 0 - Cell 1 | Row 0 - Cell 2 | Row 0 - Cell 3 | Open interest: 195,724 | ||||
| Commitments | ||||||||
| 60,282 | 94,037 | 31,180 | 88,653 | 48,097 | 180,116 | 173,314 | 15,608 | 22,410 |
| Changes from 08/04/15 (Change in open interest: 13,943) | ||||||||
| -334 | 1,083 | 9,671 | 3,123 | 1,188 | 12,460 | 11,941 | 1,483 | 2,002 |
| Percent of open in terest for each category of traders | ||||||||
| 30.8 | 48.0 | 15.9 | 45.3 | 24.6 | 92.0 | 88.6 | 8.0 | 11.4 |
| Number of traders in each category (Total traders: 302) | ||||||||
| 77 | 140 | 77 | 54 | 45 | 178 | 235 | Row 8 - Cell 7 | Row 8 - Cell 8 |
Note that in the latest week, the commercials (smart money) increased their net longs as prices fell. Conditions are right for a turn to occur at any time.
So, with the short commodity trade being a very crowded one, my money is on an upturn occurring somewhere around current levels.
Get the latest financial news, insights and expert analysis from our award-winning MoneyWeek team, to help you understand what really matters when it comes to your finances.
John is is a British-born lapsed PhD physicist, who previously worked for Nasa on the Mars exploration team. He is a former commodity trading advisor with the US Commodities Futures Trading Commission, and worked in a boutique futures house in California in the 1980s.
He was a partner in one of the first futures newsletter advisory services, based in Washington DC, specialising in pork bellies and currencies. John is primarily a chart-reading trader, having cut his trading teeth in the days before PCs.
As well as his work in the financial world, he has launched, run and sold several 'real' businesses producing 'real' products.
-
 Last chance to invest in VCTs? Here's what you need to know
Investors have pumped millions more into Venture Capital Trusts (VCTS) so far this tax year, but time is running out to take advantage of tax perks from them.
-
 ISA quiz: How much do you know about the tax wrapper?
Quiz One of the most efficient ways to keep your savings or investments free from tax is by putting them in an Individual Savings Account (ISA). How much do you know about ISAs?