Now I’m long gold
John C Burford is bullish on gold. Here, he uses his tramline methods to set his entry point in the market. But how high will the price go?
Get the latest financial news, insights and expert analysis from our award-winning MoneyWeek team, to help you understand what really matters when it comes to your finances.
You are now subscribed
Your newsletter sign-up was successful
Want to add more newsletters?

Twice daily
MoneyWeek
Get the latest financial news, insights and expert analysis from our award-winning MoneyWeek team, to help you understand what really matters when it comes to your finances.

Four times a week
Look After My Bills
Sign up to our free money-saving newsletter, filled with the latest news and expert advice to help you find the best tips and deals for managing your bills. Start saving today!
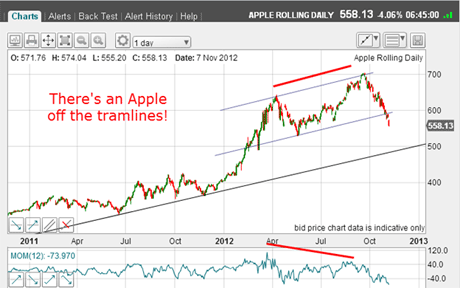
Before I cover gold, I want to show you a textbook example of a chart in Apple shares. It shows how my tramline method can be used in a wide variety of markets.
Last month, Apple was the darling of the Nasdaq and the bellwether for the tech sector. But in recent days, Apple has been falling and I want to show youhow by using my tramline method, a correct analysis could have been made.
This will go into many textbooks on technical trading, I'm sure.
MoneyWeek
Subscribe to MoneyWeek today and get your first six magazine issues absolutely FREE

Sign up to Money Morning
Don't miss the latest investment and personal finances news, market analysis, plus money-saving tips with our free twice-daily newsletter
Don't miss the latest investment and personal finances news, market analysis, plus money-saving tips with our free twice-daily newsletter
The second peak had a massive negative momentum divergence, and the tramline drawn across the two peaks is my upper line.
I can draw a parallel line across the major lows made last year and a central tramline that picks up the intervening dips. That is one very pretty tramline trio.
(Click on the chart for a larger version)
This month, the market has plunged off the $700 peak and has broken below my centre tramline a strong sell signal. Of course, there was an initial sell as the market came off the $700 peak with the negative momentum divergence staring us in the face.
This summer it was speculated that Apple would be the first ever share to make it to $1,000. Bullishness was rampant. This was yet another example of a market making a major turn as sentiment reached an extreme.
In recent days, I have noted many more negative comments in the blogosphere. Will Apple turn out to be 'Crab Apple', leaving a very bitter taste?
Gold's solid tramlines
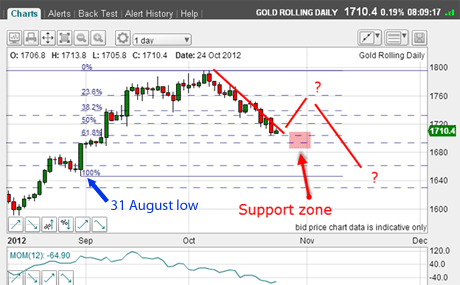
OK now to gold, as I promised. When I last left it on 2 November, I had my outline scenario:
(Click on the chart for a larger version)
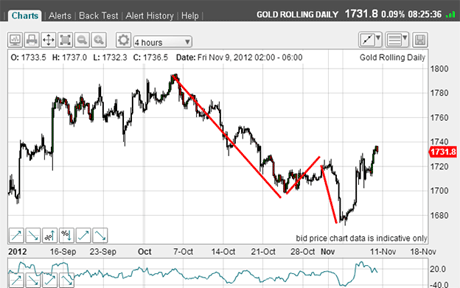
And this is how it is turning out this morning:
(Click on the chart for a larger version)
Well, I got the first stage correct in an A-B-C, but when the market hit the $1,680 area, it took off like a rocket!
Many shorts were taken by surprise, and there have been many new converts to the bearish case with one sentiment reading showing only 10% bulls. That was a massive shift in sentiment alright.
When I saw that, I knew I had to tighten stops on my short position taken around the $1,775 level and look to go long, believe it or not. But where?
Let's zoom in on the hourly chart:
(Click on the chart for a larger version)
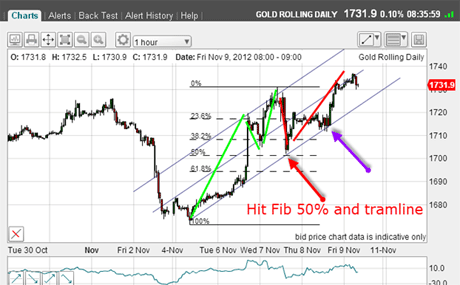
The market made a massive leap when the election results were known late Tuesday. But unlike stocks, which marched down the hill after the result, gold held most of its gains.
After climbing in an A-B-C (green bars), the move down hit the Fibonacci 50% level and bounced. I wondered if this support would hold - and as it happened, it did.
I could then put in my lower tramline, and from that, I was gratified to find that the upper line passed right across the two recent highs and has a small prior pivot point (PPP).
Then I drew in the centre line, and discovered it contained some important minor highs and lows.
The bottom line: I am very confident of these tramlines.
Then, yesterday, the market came back to touch the lowest tramline again and that was a good long entry point using a tight stop just below the tramline.
So now I have a long position in gold.
What is my target?
Let's look again at the hourly chart:
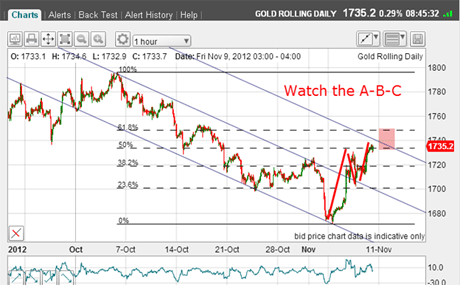
Set up for a new short trade?
(Click on the chart for a larger version)
I have drawn in the Fibonacci levels off the big swing down off the $1,796 high, and right away we are playing with the 50% level a common turning point.
And there is a clear A-B-C form to the rally and a budding negative momentum divergence currently.
When I placed the trade, I had the pink zone in mind as my target. We are already at its lower reaches.
The smart money will be looking to take profits anywhere here!
But do we have a set-up for a new short trade? I will let you decide that one.
If you're a new reader, or need a reminder about some of the methods I refer to in my trades, then do have a look at my introductory videos:
The essentials of tramline trading
An introduction to Elliott wave theory
Advanced trading with Elliott waves
Don't miss my next trading insight. To receive all my spread betting blog posts by email, as soon as I've written them, just sign up here . If you have any queries regarding MoneyWeek Trader, please contact us here.
Get the latest financial news, insights and expert analysis from our award-winning MoneyWeek team, to help you understand what really matters when it comes to your finances.
John is is a British-born lapsed PhD physicist, who previously worked for Nasa on the Mars exploration team. He is a former commodity trading advisor with the US Commodities Futures Trading Commission, and worked in a boutique futures house in California in the 1980s.
He was a partner in one of the first futures newsletter advisory services, based in Washington DC, specialising in pork bellies and currencies. John is primarily a chart-reading trader, having cut his trading teeth in the days before PCs.
As well as his work in the financial world, he has launched, run and sold several 'real' businesses producing 'real' products.
-
 Should you buy an active ETF?
ETFs are often mischaracterised as passive products, but they can be a convenient way to add active management to your portfolio
-
 Power up your pension before 5 April – easy ways to save before the tax year end
With the end of the tax year looming, pension savers currently have a window to review and maximise what’s going into their retirement funds – we look at how