The new script for the GBP/USD market
The direction of the pound against the dollar has proven decidedly tricky to pin down. Spread betting expert John C Burford puts Plan B into action.
Get the latest financial news, insights and expert analysis from our award-winning MoneyWeek team, to help you understand what really matters when it comes to your finances.
You are now subscribed
Your newsletter sign-up was successful
Want to add more newsletters?

Twice daily
MoneyWeek
Get the latest financial news, insights and expert analysis from our award-winning MoneyWeek team, to help you understand what really matters when it comes to your finances.

Four times a week
Look After My Bills
Sign up to our free money-saving newsletter, filled with the latest news and expert advice to help you find the best tips and deals for managing your bills. Start saving today!
I entitled my Wednesday post "The GBP/USD defies my analysis", because my forecast for a turn on 21 August was wrong the market did go on to higher levels. However, I had a Plan B. And it seems my new analysis is working this morning.
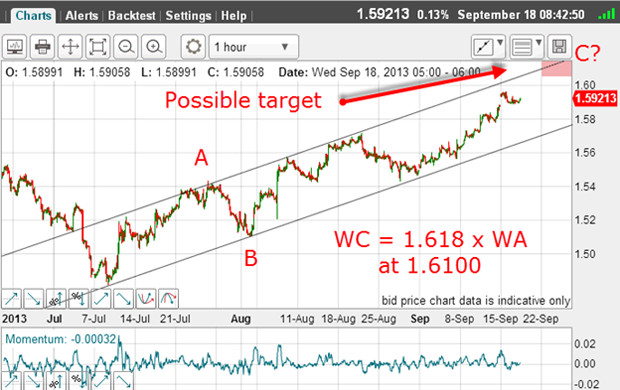
On Wednesday, just before the surprise' announcement that the Fed would not be doing any tapering any time soon, I posted a chart on GBP/USD that showed a terrific tramline pair:

Let's take a moment to examine these tramlines and how I decided to place them there. If you are using this method, it will pay to get a good handle on how to find reliable ones and on what they can yield in terms of low-risk entries and exits (the formula, WC = 1.618 X WA at 1.6100, comes into play later on, offering us support for our target).
MoneyWeek
Subscribe to MoneyWeek today and get your first six magazine issues absolutely FREE

Sign up to Money Morning
Don't miss the latest investment and personal finances news, market analysis, plus money-saving tips with our free twice-daily newsletter
Don't miss the latest investment and personal finances news, market analysis, plus money-saving tips with our free twice-daily newsletter
As you know, my tramline trading method is one of the pillars of my approach to trading. Even used on its own, it can often provide superb trade entries and exits. And so it appears to have done in this case.
The first tramline I drew was the lower line, which thankfully connected the low, the B wave low and the two or more touch points in late August. The total number of accurate touch points is at least four.
Because of the neatness of the fit of the touch points, I could consider that a highly reliable line of support to declines. Remember, that is the function of tramlines they channel trading activity as time progresses. The market swings from the upper line, then down to the lower line, and back up to the upper line, and so on until the tramline is broken.
Remember, I had a short trade working from the C wave top with my stop at break even as the market declined into the late August touch points.
Naturally, that was a place to exit a short-term trade.
I was able to make that profitable trade because of one thing I knew where to place the tramlines, and I used the simple rule of shorting near the upper tramline and covering near the lower one.
That is one very simple and very powerful method for extracting profit from the markets. The potential profit available was around 150 pips.
And in fact, if a trader used only one method, she could do a lot worse than using my tramline method in this way. Just wait for the perfect opportunity as here and pounce.
I held on to my trade as the market took me out at break even on the rally in early September. On Wednesday, I noted that because the market had moved above my old C wave top into new high ground, my old wave labels were not the whole story.
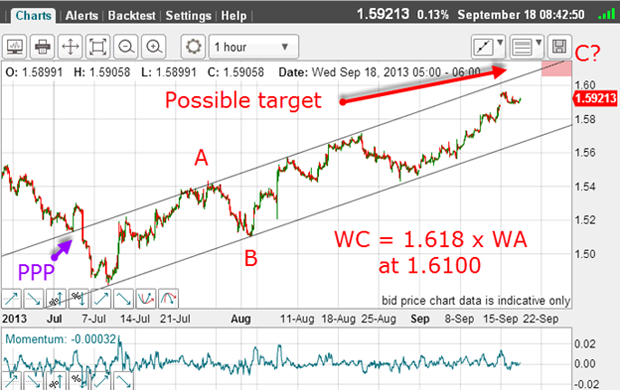
Now, from the lower tramline, I drew the parallel line taking in the major highs:

And I struck gold! I had a lovely prior pivot point (PPP), and took in the A wave highs with several touch points.
Thereafter, every time the market rallied to the line in the multiple touch points, it was turned back down. That's solid resistance.
And odds are, when it does it again, it will behave in exactly the same way.
That is why a move to the upper line is a signal to short the market in preparation to a move back down.
Not only does this give you the correct place to enter and the correct direction to trade but it allows for a close stop to be used, to be placed above the tramline.
This is because if the market does break resistance and trade above the line, that may indicate the market wants to move higher and will likely treat the line now as support.
You certainly do not want to be holding a short trade in a rising market from the off!
Signs of a trend reversal
You see, the form of the rally was still an A-B-C only with a larger C wave than I had originally thought.
The formula wave C = 1.618 x wave A, shown in my charts above, projected a target at exactly the same 1.61 level within pips.
So that was my upper target, no matter how the market moved following the Fed news.
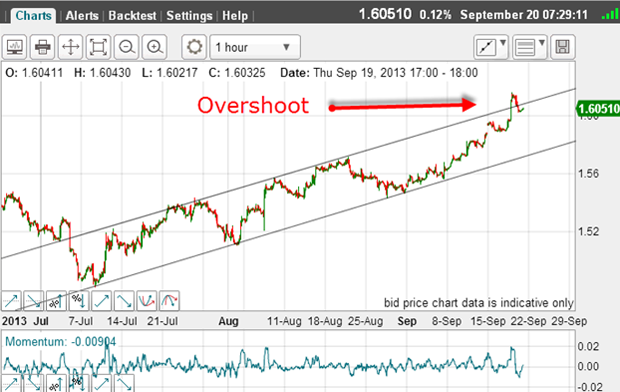
As it happened, the dollar was sold hard on the news and this was the picture Thursday:

As so often occurs after the market is hit with news it was not expecting, it over-reacted and quickly rallied to the 1.6150 level 50 pips above my target.
Then, after digesting the advance, which importantly took the market above my upper tramline, the market fell back yesterday under the line and traded inside the channel again.
This meant the market made an 'overshoot' of the line a brief foray above it before scuttling back under it.
This type of overshoot action very often signals a trend reversal particularly after a long trending move, as the GBP/USD had seen.
Because I was confident of my targets as being the likely end of the rally, I entered a short trade just above the tramline with protective stop just above the 1.6150 high.
Now the market has declined by around 100 pips off the high, I can now move my protective stop to break even for a no-risk trade.
To sum up: I have worked two short trades and both have turned out to be no-risk trades. From a money-management perspective, this is as good as it gets. If you can make trades that carry no risk of loss, you have reached trading heaven! If even one of these trades makes a profit, you are making money.
I have used mainly my tramline method to pinpoint entries, also using Elliott wave theory to identify the A-B-C patterns.
Get the latest financial news, insights and expert analysis from our award-winning MoneyWeek team, to help you understand what really matters when it comes to your finances.
John is is a British-born lapsed PhD physicist, who previously worked for Nasa on the Mars exploration team. He is a former commodity trading advisor with the US Commodities Futures Trading Commission, and worked in a boutique futures house in California in the 1980s.
He was a partner in one of the first futures newsletter advisory services, based in Washington DC, specialising in pork bellies and currencies. John is primarily a chart-reading trader, having cut his trading teeth in the days before PCs.
As well as his work in the financial world, he has launched, run and sold several 'real' businesses producing 'real' products.
-
 Barings Emerging Europe trust bounces back from Russia woes
Barings Emerging Europe trust has added the Middle East and Africa to its mandate, delivering a strong recovery, says Max King
-
 How a dovish Federal Reserve could affect you
Trump’s pick for the US Federal Reserve is not so much of a yes-man as his rival, but interest rates will still come down quickly, says Cris Sholto Heaton