My Aussie trade is working to plan
John C Burford's Australian dollar trade has proved to be a textbook example of how to use tramlines in your spread betting. So, what do the charts forecast now for the Aussie?
Get the latest financial news, insights and expert analysis from our award-winning MoneyWeek team, to help you understand what really matters when it comes to your finances.
You are now subscribed
Your newsletter sign-up was successful
Want to add more newsletters?

Twice daily
MoneyWeek
Get the latest financial news, insights and expert analysis from our award-winning MoneyWeek team, to help you understand what really matters when it comes to your finances.

Four times a week
Look After My Bills
Sign up to our free money-saving newsletter, filled with the latest news and expert advice to help you find the best tips and deals for managing your bills. Start saving today!
On Monday, I went off-piste a little by looking at a great tramline trade in the Aussie dollar.
I showed you how I used my tramline method to get into what was then a promising long Aussie trade.
The great news is that now just two days later that promise is being fulfilled and then some!
MoneyWeek
Subscribe to MoneyWeek today and get your first six magazine issues absolutely FREE

Sign up to Money Morning
Don't miss the latest investment and personal finances news, market analysis, plus money-saving tips with our free twice-daily newsletter
Don't miss the latest investment and personal finances news, market analysis, plus money-saving tips with our free twice-daily newsletter
I want to follow up on this trade right now it's offering up some great lessons I can share with you to help you develop your trading.
For one thing, as you'll see, it's demonstrating an important aspect of trading with the Elliott wave theory, which is in fact aiding my cause.
My Aussie trade is off to a flying start
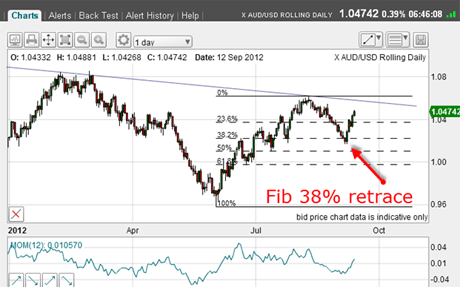
Take a look at this updated daily chart. It shows the long-term down-trend line drawn off the July 2011 high:

(Click on image above for larger version)
On Monday, I noted that the retreat to the 5 September low took it to the Fibonacci 38% retracement of the previous rally leg in fact, there was a slight overshoot.
That fact, combined with my tramlines on the shorter-range chart provided me with the inspiration to make a long trade. And I'm glad that I did.
My entry was in the 1.0240 area and the market is trading at 1.0470 as I write more than 200 pips profit in just a couple of days.
The market has followed my Elliott wave roadmap
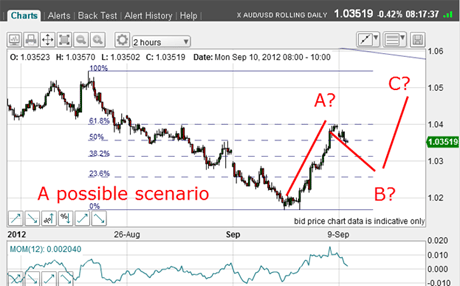
So far, so good. But on Monday, I also pencilled in a possible scenario for the following few days. Here's the chart I showed then:

(Click on image above for larger version)
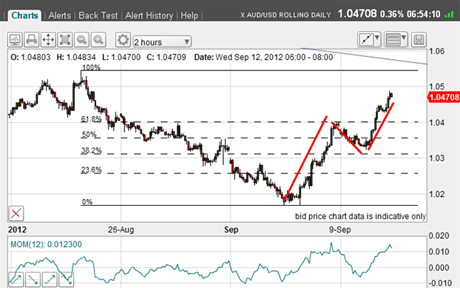
And here is the updated chart as of this morning:

(Click on image above for larger version)
Isn't that great? The form of the Monday-Wednesday action is almost precisely that which I had mapped out on Monday.
But there is a slight problem. I did identify the A wave top correctly on Monday, with the subsequent shallow B wave, leading to a wave producing a new high.
Why there could be resistance ahead
The problem is that the current up-wave does not have the typical form of a C (final) wave. For one thing, the size of this wave (which apparently has not yet topped) is a little large compared with the A and B waves.
For another, momentum, as I write, is also high on the two-hourly chart (and even higher on the hourly!) So no chance of a negative momentum divergence here.
Ideally, a momentum divergence is almost a requirement for me to seek a turn.
But, of course, that is working in my favour. This is an ideal place to look to take profits.
Now, with the market approaching the major downtrend line in the 1.0560 area it is only 80 pips away I expect some resistance to the advance to emerge.
And tomorrow, the Fed is due to release its intentions regarding another round of QE. That should impact the stock and bond markets.
Stocks have been rallying on the hope for more QE. Will that hope be realised? If so, will it lead to further large gains for shares? Or will it be a case of buy the rumour, sell the news' and a market sell-off.
If you're a new reader, or need a reminder about some of the methods I refer to in my trades, then do have a look at my introductory videos:
The essentials of tramline trading
An introduction to Elliott wave theory
Advanced trading with Elliott waves
Don't miss my next trading insight. To receive all my spread betting blog posts by email, as soon as I've written them, just sign up here . If you have any queries regarding MoneyWeek Trader, please contact us here.
Get the latest financial news, insights and expert analysis from our award-winning MoneyWeek team, to help you understand what really matters when it comes to your finances.
John is is a British-born lapsed PhD physicist, who previously worked for Nasa on the Mars exploration team. He is a former commodity trading advisor with the US Commodities Futures Trading Commission, and worked in a boutique futures house in California in the 1980s.
He was a partner in one of the first futures newsletter advisory services, based in Washington DC, specialising in pork bellies and currencies. John is primarily a chart-reading trader, having cut his trading teeth in the days before PCs.
As well as his work in the financial world, he has launched, run and sold several 'real' businesses producing 'real' products.
-
 ISA fund and trust picks for every type of investor – which could work for you?
Whether you’re an ISA investor seeking reliable returns, looking to add a bit more risk to your portfolio or are new to investing, MoneyWeek asked the experts for funds and investment trusts you could consider in 2026
-
 The most popular fund sectors of 2025 as investor outflows continue
It was another difficult year for fund inflows but there are signs that investors are returning to the financial markets