Markets make the news – not vice versa
News watchers will have got burnt by the Fed announcement, says John C Burford. But not traders following Elliott wave theory.
Get the latest financial news, insights and expert analysis from our award-winning MoneyWeek team, to help you understand what really matters when it comes to your finances.
You are now subscribed
Your newsletter sign-up was successful
Want to add more newsletters?

Twice daily
MoneyWeek
Get the latest financial news, insights and expert analysis from our award-winning MoneyWeek team, to help you understand what really matters when it comes to your finances.

Four times a week
Look After My Bills
Sign up to our free money-saving newsletter, filled with the latest news and expert advice to help you find the best tips and deals for managing your bills. Start saving today!
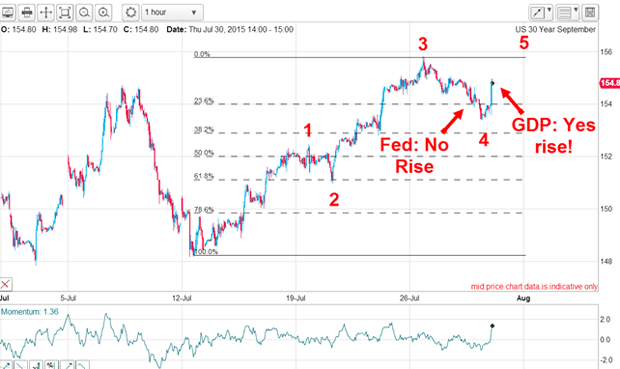
The results meant the pressure on interest rates markets had been eased and yet T-bond yields rose (prices dropped).
Yesterday the US second quarter (Q2) GDP data was released and showed an upward revision to the Q1 figure and a decent Q2 one. The consensus after the release was that the Fed would increase the Fed Funds rate after all, because the economy was stronger than originally thought. Talk about a whipsaw!
Just look at how the T-bonds reacted instead of yields rising in anticipation of rising short-term rates, they declined (prices rallied). How perverse is that?
MoneyWeek
Subscribe to MoneyWeek today and get your first six magazine issues absolutely FREE

Sign up to Money Morning
Don't miss the latest investment and personal finances news, market analysis, plus money-saving tips with our free twice-daily newsletter
Don't miss the latest investment and personal finances news, market analysis, plus money-saving tips with our free twice-daily newsletter

If you were not trading off the news, but trading with a time-tested system such as the Elliott wave model, you would recognise several important features of the hourly chart early in the week and could have anticipated market action (and profited).
Ignore the news and focus on your charts
The wave 3 high was made on Monday. If you recognised that, you would naturally expect to see a dip in wave 4 hopefully in a normal three-wave A-B-C no matter what news emerged.
So that was the roadmap laid out for the market on Monday/Tuesday. And that is what it delivered despite the aforementioned 'bullish' Fed news and 'bearish' GDP data.
Now when the A-B-C completed yesterday morning, the market was primed to embark on a rally in wave 5 despite the GDP news.
This whole episode kicked off in mid-July as the market was testing the support in the 148-149 area. And that was when bullish sentiment had reached very low levels below 10% as the market was convinced interest rates would soon be rising. That shows the power of sentiment signals.
The lesson here is that wave patterns rule the markets, not the news. If you can divine what the correct pattern is, you can often trade against the news and take money off those that do.
But is there anything else we can reasonably forecast from this chart? I believe there is. Note the short duration of the third wave only six days. One rule of Elliott wave theory states that the third wave is never the shortest. Therefore, with wave 1 lasting more than six days, our new wave 5 is likely to last fewer than six days because it needs to be shorter than either wave 1 or wave 3.
But that may not be the whole story. This five-wave advance could be only part of a larger pattern. But one step at a time all a swing trader needs is a move of a few hundreds of pips in a few days and he or she is happy.
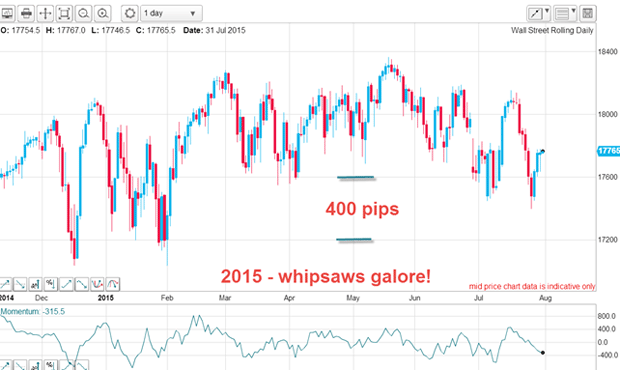
Traders can make money even when an index goes nowhere

Basically, the market has gone nowhere this year but has suffered many huge swings. If you were spread betting (with leverage, as opposed to buying an index tracker with cash) and trying to time your trades, it is highly likely you would be stopped out many, if not all, times. It has been a graveyard for many traders. And it has stretched over an eternity of at least seven months precious time when other markets were offering great swing trades (as in the T-bonds).
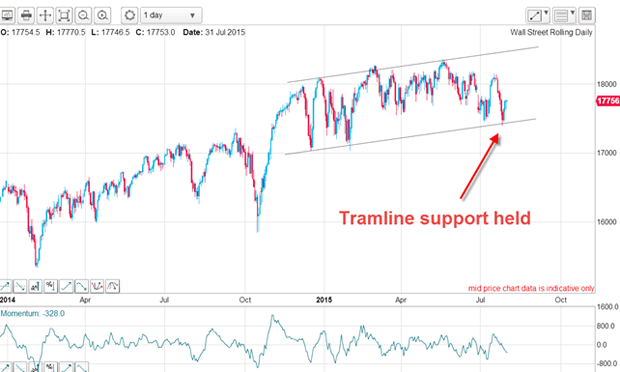
I got to use one of my favourite setups on the Dow

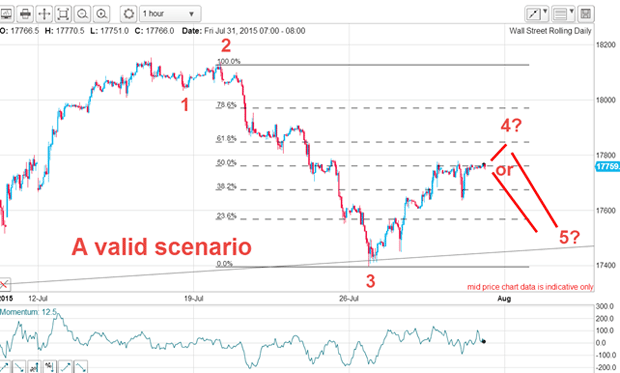
On Monday, as it was plunging (along with Chinese stocks), my lower tramline support was about to be tested. And the test was successful. Of course, a solid break would be very bearish. And on the hourly, the market has rallied to the Fibonacci 50% level:

This is a big test for the rally and I have two main alternative paths shown. And if my labels are correct, the market could top out soon and resume its slide. But the good trade was the wave 3 decline. I love trading them they are among my five top trade setups.
Get the latest financial news, insights and expert analysis from our award-winning MoneyWeek team, to help you understand what really matters when it comes to your finances.
John is is a British-born lapsed PhD physicist, who previously worked for Nasa on the Mars exploration team. He is a former commodity trading advisor with the US Commodities Futures Trading Commission, and worked in a boutique futures house in California in the 1980s.
He was a partner in one of the first futures newsletter advisory services, based in Washington DC, specialising in pork bellies and currencies. John is primarily a chart-reading trader, having cut his trading teeth in the days before PCs.
As well as his work in the financial world, he has launched, run and sold several 'real' businesses producing 'real' products.
-
 Adventures in Saudi Arabia
Travel The kingdom of Saudi Arabia in the Middle East is rich in undiscovered natural beauty. Get there before everybody else does, says Merryn Somerset Webb
-
 ISA fund and trust picks for every type of investor – which could work for you?
Whether you’re an ISA investor seeking reliable returns, looking to add a bit more risk to your portfolio or are new to investing, MoneyWeek asked the experts for funds and investment trusts you could consider in 2026