Markets are driven entirely by emotion
Most economists and market commentators completely misunderstand how markets work, says John C Burford. What really drives markets is emotion. Here, he illustrates how.
Get the latest financial news, insights and expert analysis from our award-winning MoneyWeek team, to help you understand what really matters when it comes to your finances.
You are now subscribed
Your newsletter sign-up was successful
Want to add more newsletters?

Twice daily
MoneyWeek
Get the latest financial news, insights and expert analysis from our award-winning MoneyWeek team, to help you understand what really matters when it comes to your finances.

Four times a week
Look After My Bills
Sign up to our free money-saving newsletter, filled with the latest news and expert advice to help you find the best tips and deals for managing your bills. Start saving today!
It still amazes me that even respectable economists completely misunderstand how markets really work.
I can excuse this in mainstream media commentators (whose job depends on conforming to received wisdom') and the general public, but when I read this in a recent article by Liam Hallligan in the Telegraph: "The US housing market is at its most buoyant for seven years, with real estate prices up 10.9% in March. That's helped to drive consumer sentiment to a five-year high", I react just as I do when I spot a greengrocer's apostrophe (Banana's £1).
Mr Halligan, like the vast majority of people, including the experts', has the cart before the horse. He makes a crucial error that alone produces sentiment extremes that savvy traders can exploit. I will explain using the most recent commitments of traders (COT) data.
MoneyWeek
Subscribe to MoneyWeek today and get your first six magazine issues absolutely FREE

Sign up to Money Morning
Don't miss the latest investment and personal finances news, market analysis, plus money-saving tips with our free twice-daily newsletter
Don't miss the latest investment and personal finances news, market analysis, plus money-saving tips with our free twice-daily newsletter
What really drives markets
Has the trader read that the US housing market is at its most buoyant in seven years and suddenly gets the urge to ring their broker? Have they summoned up enough confidence to buy after reading that piece of news, whereas before, they were sitting on their hands?
Now suppose our trader has just lost their job, or has had a major family trauma or other setback. Will our trader be in any mood to actually think about his/her investments? I think not. They will not be buying or selling anything.
Whether or not they act will depend on their mental state at the time and this will be largely untouched by the US housing market data!
When we act, we only do so in a manner consistent with our mental state the state of our emotions. The emotion comes first, and then follows the act (or not).
I have long maintained that most traders make their buying and selling decisions on pure emotion, largely divorced from any rational analysis they may have made, despite what they believe!
Now apply these mental processes across the universe of traders/investors and you have markets that are driven by the aggregate emotion, or sentiment, whether it is bullish or bearish. An internal confidence drives bulls and uncertainty drives bears.
And this is what creates the herd.
The great swings in sentiment are internally-driven not caused by outside events, such as US housing data. The fact that the US housing market is at its best in seven years follows from the confident mood existing in the housing market. It may be the top!
And when you understand this, you are in a position to understand why markets top out when confidence is very high, and vice versa.
Most people become more and more bullish as markets rise. This is a natural human reaction, and is why we see sentiment extremes near tops and bottoms. But it is a killer in trading. This is one of the perverse features in trading financial markets, and is the one main reason most people fail to spot major turning points.
To position for profit, the trader needs to train themselves to overcome this sentiment and try to become more bearish as prices rise, especially after a long run, as we have seen in stocks.
The Dow and Nikkei illustrate my point
The data was released last Friday for futures holdings as of Tuesday 28 May. Note this date - it was the day the Dow (and the other indexes) was rallying back towards the highs set on 22 May. Between 22 and 28 May, stocks had fallen quite sharply.
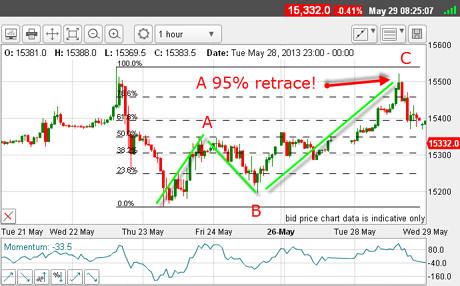
Here is the Dow chart I took on Tuesday, just after the rally top:

(Click on the chart for a larger version)
The rally on Tuesday had reached a 95% retracement from the 22 May high. This is the date of the COT data, of course. So it is a very significant one.
And on Tuesday, the Dow was in full rally mode. And because investors had been buying the dips for many months, I expected the same that the COT data would reveal an increase in bullish bets during the week of 21-28 May.
Let's see what the data says:
| $5 X DJIA INDEX | Row 0 - Cell 1 | Row 0 - Cell 2 | Row 0 - Cell 3 | Open interest: 115,832 | ||||
| Commitments | ||||||||
| 42,848 | 7,548 | 130 | 52,140 | 86,430 | 95,118 | 94,108 | 20,714 | 21,724 |
| Changes from 21/5/13 (Change in open interest: 711) | ||||||||
| 2,146 | -977 | -876 | -1,184 | 2,467 | 86 | 685 | 157 | -1,988 |
| Percent of open in terest for each category of traders | ||||||||
| 37.0 | 6.5 | 0.1 | 45.0 | 74.6 | 82.1 | 81.2 | 17.9 | 18.8 |
| Number of traders in each category (Total traders: 98) | ||||||||
| 33 | 12 | 5 | 33 | 29 | 67 | 45 | Row 8 - Cell 7 | Row 8 - Cell 8 |
But the scale of lop-sidedness is staggering: hedge funds hold a 5.7:1 bullish bias. Remember, these are big trend-followers, and the trend has definitely been up.
They have become more bullish as the market rallied (see above). This is an ideal set-up for a major reversal.
And since 28 May, markets have fallen and some have fallen very sharply. In fact, the Dow has declined by over 400 pips.
OK, how about the Japanese Nikkei?

(Click on the chart for a larger version)
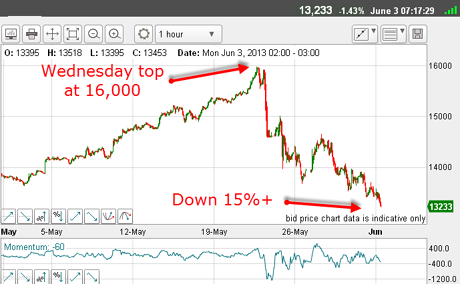
Now that's what I call a burst bubble! But was the Nikkei in a similarly lop-sided condition?
| NIKKEI INDEX X JPY 500 | Row 0 - Cell 1 | Row 0 - Cell 2 | Row 0 - Cell 3 | Open interest: 93,321 | ||||
| Commitments | ||||||||
| 35,129 | 6,725 | 2,916 | 42,709 | 30,445 | 80,754 | 40,086 | 12,567 | 53,235 |
| Changes from 21/5/13 (Change in open interest: -2,268) | ||||||||
| -2,846 | -2,593 | 1,465 | -4,162 | -5,915 | -5,546 | -7,046 | 3,278 | 4,778 |
| Percent of open interest for each category of traders | ||||||||
| 37.6 | 7.2 | 3.1 | 45.8 | 32.6 | 86.5 | 43.0 | 13.5 | 57.0 |
| Number of traders in each category (Total traders: 100) | ||||||||
| 30 | 12 | 5 | 42 | 26 | 73 | 42 | Row 8 - Cell 7 | Row 8 - Cell 8 |
And note the market's fall is very swift compared with its rate of ascent. This is perfectly normal and fits in with my long liquidation scenario.
In both markets, the herd had the confidence to pump up prices and the bears lacked the uncertainty to challenge them until there were no more bulls to keep the ball in the air.
Both markets have offered bearishly-inclined traders an opportunity to short into the rallies and take quick profits as many longs are liquidated.
But who had the nerve to swim against the tide? Not many, judging from the COT data (and sentiment readings).
The question for longer-term traders is how low will the market go?
The FTSE is at a crossroads

(Click on the chart for a larger version)
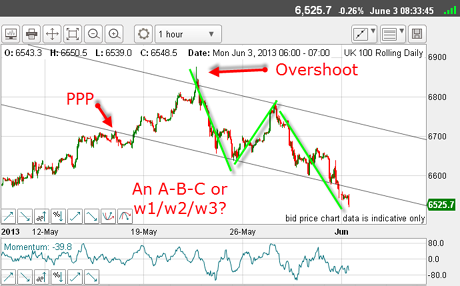
The 22 May high was a spiky overshoot, as is normal at the end of a long and strong rally.
My lower tramline is excellent complete with a prior pivot point (PPP) and we are in a third wave down.
Now, this could be either a C wave of a correction (still up), or a third wave of a larger five-wave sequence (a new down move).
Recall that the move off the 22 May top is a small-scale five-wave move, indicating the trend has likely turned to down.
One way to help eliminate the A-B-C theory is to measure the A and C waves and use the common relationship of equality.
If we are in a C wave, it should end at around the 6,550 level. As I write, it is trading at 6,530, which places it in the same area.
This means that at this stage, I cannot eliminate the A-B-C interpretation. And if it is an A-B-C, then that implies the rally is likely not yet over.
I shall be watching if and when the market rallies back slightly to the underside of the lower tramline. This area will be a good test.
This is just one of the many ways you can use basic Elliott Wave theory to construct your roadmap.
If you're a new reader, or need a reminder about some of the methods I refer to in my trades, then do have a look at my introductory videos:
The essentials of tramline trading Advanced tramline trading An introduction to Elliott wave theory Advanced trading with Elliott waves Trading with Fibonacci levels Trading with 'momentum' Putting it all together
Don't miss my next trading insight. To receive all my spread betting blog posts by email, as soon as I've written them, just sign up here . If you have any queries regarding MoneyWeek Trader, please contact us here.
Get the latest financial news, insights and expert analysis from our award-winning MoneyWeek team, to help you understand what really matters when it comes to your finances.
John is is a British-born lapsed PhD physicist, who previously worked for Nasa on the Mars exploration team. He is a former commodity trading advisor with the US Commodities Futures Trading Commission, and worked in a boutique futures house in California in the 1980s.
He was a partner in one of the first futures newsletter advisory services, based in Washington DC, specialising in pork bellies and currencies. John is primarily a chart-reading trader, having cut his trading teeth in the days before PCs.
As well as his work in the financial world, he has launched, run and sold several 'real' businesses producing 'real' products.
-
 Average UK house price reaches £300,000 for first time, Halifax says
While the average house price has topped £300k, regional disparities still remain, Halifax finds.
-
 Barings Emerging Europe trust bounces back from Russia woes
Barings Emerging Europe trust has added the Middle East and Africa to its mandate, delivering a strong recovery, says Max King