It's panic stations for traders on Wall Street
Major bear markets are now under way, says John C Burford. Traders positioned correctly will reap a massive harvest.
Get the latest financial news, insights and expert analysis from our award-winning MoneyWeek team, to help you understand what really matters when it comes to your finances.
You are now subscribed
Your newsletter sign-up was successful
Want to add more newsletters?

Twice daily
MoneyWeek
Get the latest financial news, insights and expert analysis from our award-winning MoneyWeek team, to help you understand what really matters when it comes to your finances.

Four times a week
Look After My Bills
Sign up to our free money-saving newsletter, filled with the latest news and expert advice to help you find the best tips and deals for managing your bills. Start saving today!
Wow! Did you hear that loud hissing sound yesterday? That was the bursting of the gigantic bubble in global stockmarkets. We are in historic times with major bear markets now under way, make no mistake. And traders positioned correctly will reap a massive harvest.
The Dow (my favourite trading vehicle) was off almost 400 pips yesterday and overnight. It is down another 100 pips or more on the back of Chinese manufacturing data that supports my long-held view that the hard landing for China is already in progress.
The Chinese PMI (purchasing managers index) data released overnight came in way under expectations, and confirms a rapidly shrinking manufacturing sector. When coupled with declining exports data, the currency market will likely pre-empt the authorities and perform another yuan devaluation before too long. This will put further pressure on other currencies as they race to the bottom. The currency war will then rage in earnest.
MoneyWeek
Subscribe to MoneyWeek today and get your first six magazine issues absolutely FREE

Sign up to Money Morning
Don't miss the latest investment and personal finances news, market analysis, plus money-saving tips with our free twice-daily newsletter
Don't miss the latest investment and personal finances news, market analysis, plus money-saving tips with our free twice-daily newsletter
We're on the brink of a global deflationary depression
Central banks are out of ammo, and anyway, the market mood is shifting. Any move to expand liquidity by doing more quantitative easing (QE) will be met by more panic-selling as traders will know the game is up. China is finding that out the hard way.
Gold and silver are rocketing (as I forecast) in response to the turmoil in stocks.
In my post of 12 August"China has just lit the firecracker under the market", I covered the Dow in some detail. If you invest in common stocks and/or trade the financial markets, I recommend you re-read that piece, because it is even more relevant today.
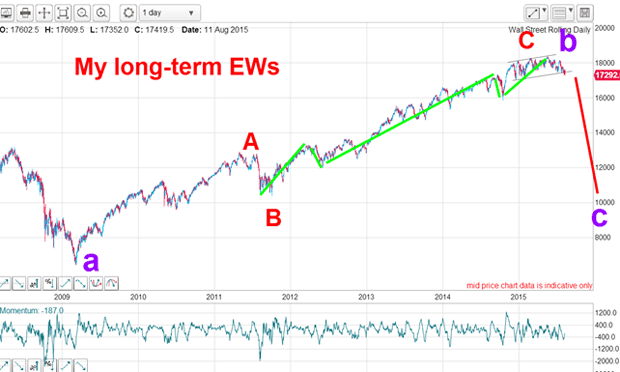
Below is the chart I posted on the long-term picture. The entire rally off the 2009 low was in reality a corrective pattern with the red A-B-Cs. That is true even though the Dow traced out an all-time high on 19 May. The Elliott wave theory implication is this: When the red A and purple 'b' waves top out together, the resultant purple 'c' wave will be devastating and sweep all before it. We are starting to see that very process in action.
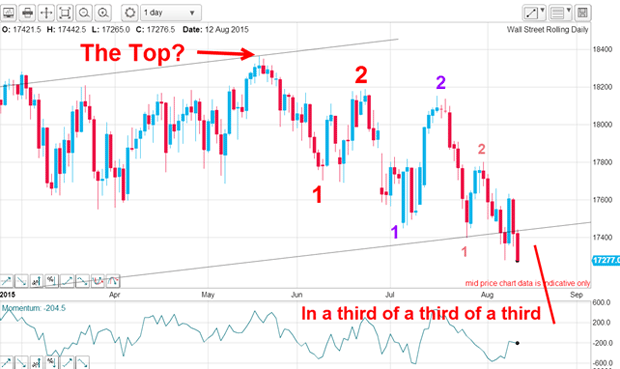
Another point I made was that the short-term chart was showing a series of 1-2s down off the 19 May top. That implied the market was then starting wave 3s in at least three degrees of trend. This was the chart then:
And below is the same chart updated. Right on cue, the market has descended very rapidly in the three wave 3s. It is currently heading towards my target at T3. This is a normal tramline target that I always propose when a tramline is broken.
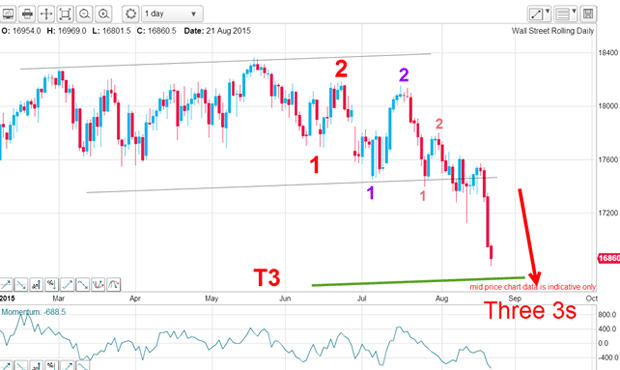
So in fact, yesterday's mammoth daily loss of 400 pips is perfectly understandable when you understand how the Elliott waves can forecast market moves.
Panic is beginning to intensify
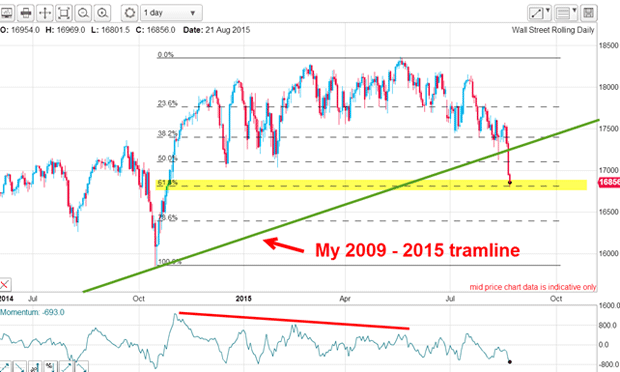
The next chart clearly shows the crucial break of the 2009-2015 tramline. This morning, the market has fallen right to the Fibonacci 62% support level. This is the region where turns can often be made. But because the selling pressure has been very intense, it would not be a total surprise to me to see this level breached fairly soon.
Yesterday, I ran quickly down the list of US shares on my trading platform and found only a handful without red losses against their name. Panic is setting in and is set to intensify.
A few weeks ago, I covered some of the US market darlings and concluded they were about to get into real trouble. Below is the sine qua non of the tech bubble Apple. Since I pointed out the likely problems, the market has fallen sharply and is currently about 15% off its high, despite massive stock buy-backs.
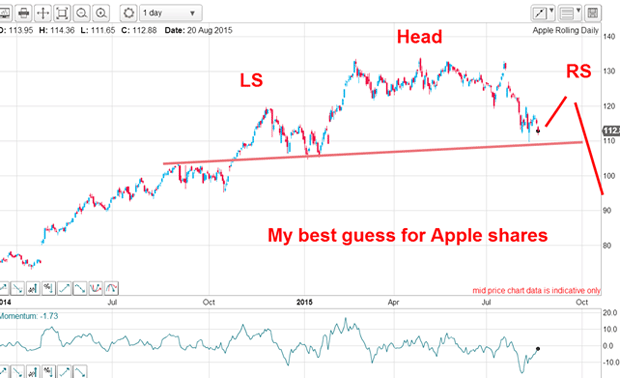
My best guess is that the market is in the process of making a head and shoulders reversal top with a bounce from near current levels to form the right shoulder. Following that, a decline to the neckline (tan line) and then a break to confirm the reversal.
It will be fun following this roadmap, because if I am right, there would be a trade available on the right shoulder.
As someone once said: "If you are going to panic, it is best to panic early".
Get the latest financial news, insights and expert analysis from our award-winning MoneyWeek team, to help you understand what really matters when it comes to your finances.
John is is a British-born lapsed PhD physicist, who previously worked for Nasa on the Mars exploration team. He is a former commodity trading advisor with the US Commodities Futures Trading Commission, and worked in a boutique futures house in California in the 1980s.
He was a partner in one of the first futures newsletter advisory services, based in Washington DC, specialising in pork bellies and currencies. John is primarily a chart-reading trader, having cut his trading teeth in the days before PCs.
As well as his work in the financial world, he has launched, run and sold several 'real' businesses producing 'real' products.
-
 UK interest rates live: rates held at 3.75%
The Bank of England’s Monetary Policy Committee (MPC) met today to decide UK interest rates, and voted to hold rates at their current level
-
 MoneyWeek Talks: The funds to choose in 2026
Podcast Fidelity's Tom Stevenson reveals his top three funds for 2026 for your ISA or self-invested personal pension