China has just lit a firecracker under the market
China finally unleashed its big bazooka – devaluing its currency. John C Burford looks at the effect it will have on the markets.
Get the latest financial news, insights and expert analysis from our award-winning MoneyWeek team, to help you understand what really matters when it comes to your finances.
You are now subscribed
Your newsletter sign-up was successful
Want to add more newsletters?

Twice daily
MoneyWeek
Get the latest financial news, insights and expert analysis from our award-winning MoneyWeek team, to help you understand what really matters when it comes to your finances.

Four times a week
Look After My Bills
Sign up to our free money-saving newsletter, filled with the latest news and expert advice to help you find the best tips and deals for managing your bills. Start saving today!
It was inevitable, but China finally unleashed its big bazooka on Monday night by devaluing its currency. The move has re-booted the global currency race to the bottom, prompted by China's recent horrendous economic data (exports down 7% in July, for example), as its hard landing gets under way.
The implications are clear more global deflation is coming, with prices of consumer goods from China (and elsewhere) still falling. The deflationary depression for Western nations that I have been warning about is now getting that much closer.
It is interesting that the devaluation was billed as a 2% cut against the dollar. I wanted to see what the real world market made of that. Below is the Market Vectors renminbi exchange rate against the US dollar. The market shaved 6% off the rate yesterday.
MoneyWeek
Subscribe to MoneyWeek today and get your first six magazine issues absolutely FREE

Sign up to Money Morning
Don't miss the latest investment and personal finances news, market analysis, plus money-saving tips with our free twice-daily newsletter
Don't miss the latest investment and personal finances news, market analysis, plus money-saving tips with our free twice-daily newsletter
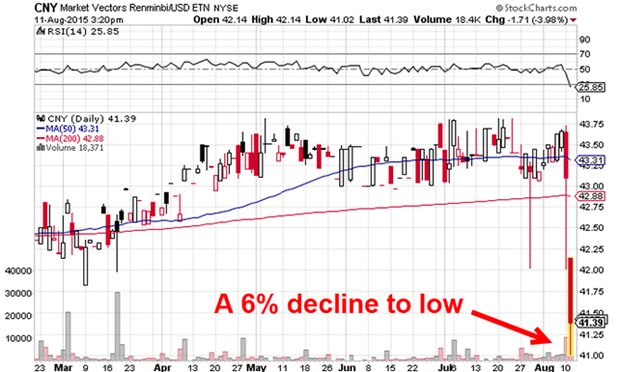
Evidently, the market believes that Monday's devaluation won't be the last one, as China grapples with the juggling act of keeping the stockmarket and the economy in the air. Good luck with that.
Even junk bonds have turned bearish
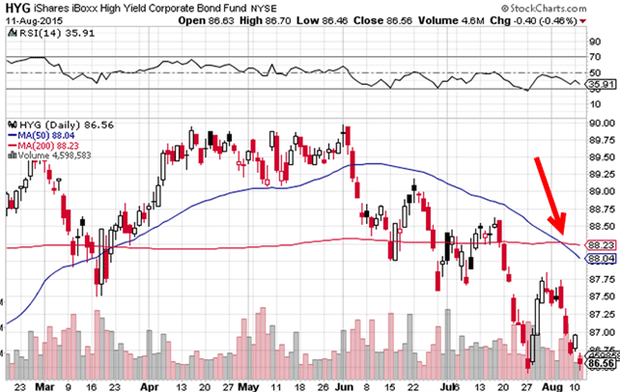
Below is my favourite junk bond price index. I monitor this constantly (as a measure of risk-on/risk-off). Remember falling prices equates to rising yields.
There are several key features here. First, there is a 'head and shoulders' top pattern (this is a reversal pattern) and second, a much-watched crossover of the 50-day and 200-day moving averages which are both turning down. This is a very bearish picture.
And to cap it all, the ultra-safe US Treasury bond yields are falling in a 'flight to safety', while junk bond yields are rising. The spread between then, which is another measure of risk-on/risk-off, is widening rapidly.
The Dow looks set to continue its decline
This was the situation on the daily chart I showed on Monday:
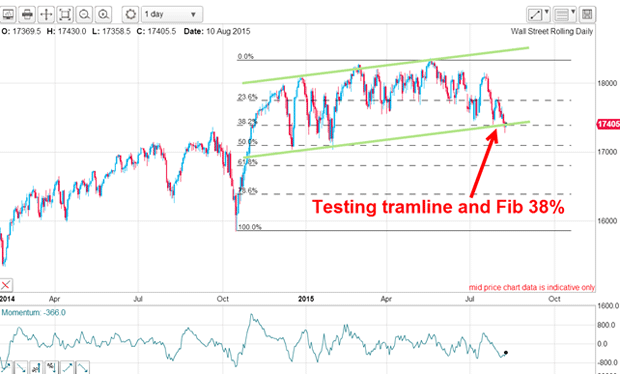
Recall that since the start of the year the market, which had enjoyed a terrific bull run almost uninterrupted since 2009, has been churning in wide bands basically going nowhere. Upward momentum was being lost as the battle between inflation and deflation started hotting up.
The central banks were hell-bent on pumping liquidity into markets (inflationary), while those very policies were encouraging over-production of everything from Chinese knick-knacks to commodities (deflationary). Hence the titanic global battle taking place in the financial markets.
My view has always been that with the resultant historic debt overload, deflation would win out and over-valued and over-leveraged assets would suffer, including stockmarkets.
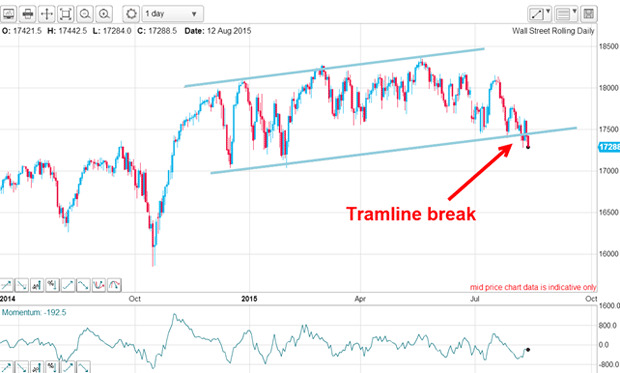
This is the Dow chart as of this morning. Overnight, the market has made a clear break of my lower tramline and provided yet another sell signal:
But what to make of the very complex Elliott waves? After all, I use these concepts to mark out my roadmap that I believe the market will follow.
Below are my long-term waves from the 2009 low. The entire 2009 2015 bull run is a 'b' wave. When it tops out, it will result in a fierce 'c' wave down, which will take the market below the 'a' wave. The 'b' wave lasted over six years, but because the 'c' wave should decline with speed, it's likely to last nowhere near as long perhaps two years or so.
The 'b' wave contains a clear three-wave A-B-C with the C wave sporting its own 'five-up' pattern. All of this is textbook behaviour.
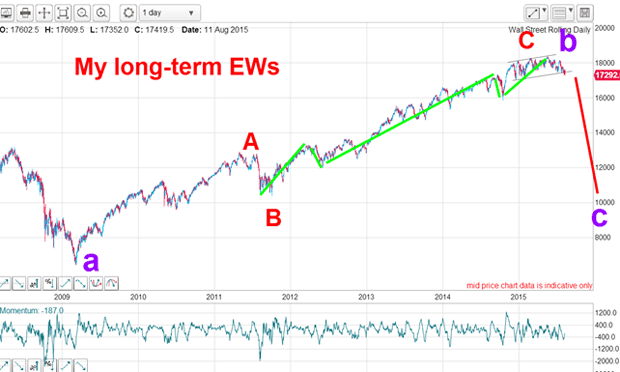
The big question now is whether the market has already completed the C and 'b' waves and has now entered the 'c' wave (which itself should contain its own five wave pattern). If so, then the May 19 high at 18,365 would be the top.
One of the signs I look for when I suspect a major turn is to look for a small-scale five down (and then a three up). Below are my Elliott wave labels. My red wave 1 down does possess a small-scale five down and my red wave 2 up is an A-B-C. The market has thus passed that litmus test of a five down/three up.
But the decline off the 19 May high has been in a typical stair-step manner with the second waves partially retracing the wave 1 downs.
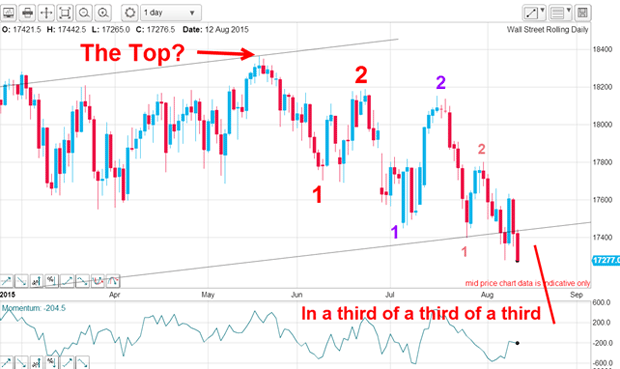
If this is correct, the market is currently in third waves of at least three degrees of trend. This is the most powerful pattern in the book.
And as the market declines, I am extremely curious as to whether the buy the dip' crowd are getting excited about the chance to pick up some 'cheap' shares (as they have since 2009)?
August, normally a holiday month, promises terrific action for swing traders and investors alike. Remember, there are countless exchange-traded funds (ETFs) that go up when shares go down.
Get the latest financial news, insights and expert analysis from our award-winning MoneyWeek team, to help you understand what really matters when it comes to your finances.
John is is a British-born lapsed PhD physicist, who previously worked for Nasa on the Mars exploration team. He is a former commodity trading advisor with the US Commodities Futures Trading Commission, and worked in a boutique futures house in California in the 1980s.
He was a partner in one of the first futures newsletter advisory services, based in Washington DC, specialising in pork bellies and currencies. John is primarily a chart-reading trader, having cut his trading teeth in the days before PCs.
As well as his work in the financial world, he has launched, run and sold several 'real' businesses producing 'real' products.
-
 Average UK house price reaches £300,000 for first time, Halifax says
While the average house price has topped £300k, regional disparities still remain, Halifax finds.
-
 Barings Emerging Europe trust bounces back from Russia woes
Barings Emerging Europe trust has added the Middle East and Africa to its mandate, delivering a strong recovery, says Max King