Is the tide turning for the gold price?
John C Burford looks at how the ebb and flow of investor sentiment makes markets swing from high to low – and what it means for the gold price.
Get the latest financial news, insights and expert analysis from our award-winning MoneyWeek team, to help you understand what really matters when it comes to your finances.
You are now subscribed
Your newsletter sign-up was successful
Want to add more newsletters?

Twice daily
MoneyWeek
Get the latest financial news, insights and expert analysis from our award-winning MoneyWeek team, to help you understand what really matters when it comes to your finances.

Four times a week
Look After My Bills
Sign up to our free money-saving newsletter, filled with the latest news and expert advice to help you find the best tips and deals for managing your bills. Start saving today!
"There is a tide in the affairs of men which, taken at the flood leads on to fortune. Omitted, all the voyage of their life is bound in shallows and miseries"
Julius Caesar, W Shakespeare
Was Shakespeare the first Elliottician? If a derivatives market was trading back then, he could have had a career as a great chart reader to fall back on if that playwright thing didn't work out. As it happened, it did.
MoneyWeek
Subscribe to MoneyWeek today and get your first six magazine issues absolutely FREE

Sign up to Money Morning
Don't miss the latest investment and personal finances news, market analysis, plus money-saving tips with our free twice-daily newsletter
Don't miss the latest investment and personal finances news, market analysis, plus money-saving tips with our free twice-daily newsletter
The concept of tides is apt for describing how traders swing en masse from one emotional extreme to the other and thus create the price swings from highs to lows.
Today, I want to show you how this applies to the gold market.
Which party would you join?
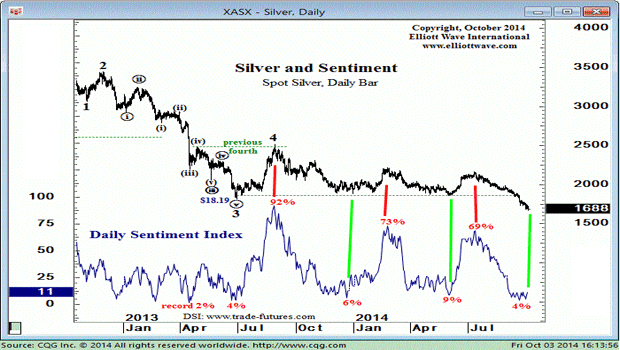
In Saturday's workshop, I showed this slide on silver:

Chart courtesy elliottwave.com
Just take a second and admire the way the daily sentiment index (DSI) sentiment indicator swings up and down with prices. At the high tides, DSI reaches 70% bulls and above. At low tides, it reaches low single figures. In June 2013, bullish sentiment was a minuscule 4%, meaning there were an amazing 24 bears for every bull.
Now picture two parties. In one, there are 24 very happy even ecstatic people, laughing and swilling back the ample supplies of Krug 1988 champagne as they congratulate themselves on their fabulous forecasting skills. The market is going their way and they are all making massive profits on their shorts (on paper). They are outdoing each other in the size of the yachts they are about to order.
In the other party, there were four sad-looking individuals, nursing their orange juices because that is all they could afford as they were losing vast sums with their wrong-way long bets.
My question to you is this: which party would you rather join? Your answer will show whether you are likely to succeed in trading or not.
The basic pattern covering all major markets
So what makes sentiment move in these great tidal waves?
Can it be the news? The macro economic data? Changes in mine production? Changes in industrial demand? Changes in demand for silver coins? Can it be a well-known guru's opinions?
Elliott wave theory(EWT) suggests that it is none of these: trader sentiment is internally generated and is independent of the fundamentals', and that sentiment is patterned in what we call Elliott waves. This pattern is simple: five waves in the main direction and three against. That is the basic pattern covering all major markets.
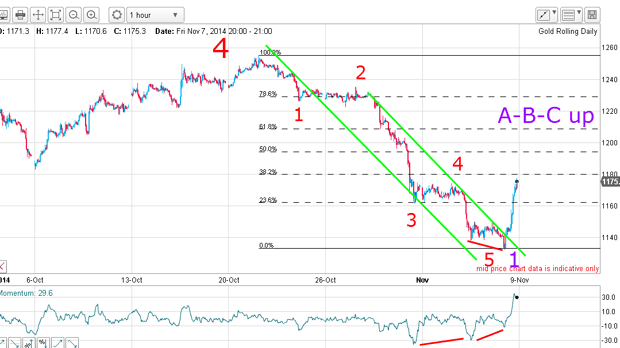
And to show how this is revealed in real time, here is recent action in the gold price:

At the wave 4 high in October, DSI was around 35% bulls. Last week, near the Friday low, DSI had fallen to only 3% bulls a record all-time low since records began in 1987.
The move off the $1,250 high took place in five clear waves. There was a long and strong third wave and a large positive momentum divergenceat the wave 5 low.
Not only that, but my upper tramlinewas broken to the upside, marking a long trade signal according to my tramline trading rules. Remember, a tramline break indicates a trend change.
Why being a trend follower is dangerous when the tide turns
Recall in my 31 Octoberarticleon the gold price, I wrote: "A critical test for a continuation of the bear market would be today's closing price on Comex. If it closes solidly lower than the $1,180 support, then we can say that support has been breached and that should open the floodgates to much lower prices"
The market certainly did trade well under $1,180 and took out many sell-stops. But that is when I decided to examine the commitments of traders (COT) data and discover how the hedge funds were reacting to the latest plunge:
| Contracts of 100 Troy ounces | Row 0 - Cell 1 | Row 0 - Cell 2 | Row 0 - Cell 3 | Open interest: 417,377 | ||||
| Commitments | ||||||||
| 176,889 | 113,674 | 44,595 | 161,667 | 216,974 | 383,161 | 675,243 | 34,216 | 42,134 |
| Changes from 28/10/14 (Change in open interest: 2,967) | ||||||||
| -18,986 | 18,528 | 4,814 | 15,322 | -28,235 | 1,150 | -4,896 | 1,817 | 7,860 |
| Percent of open in terest for each category of traders | ||||||||
| 42.4 | 27.2 | 10.7 | 38.7 | 52.0 | 91.8 | 89.9 | 8.2 | 10.1 |
| Number of traders in each category (Total traders: 327) | ||||||||
| 123 | 123 | 80 | 52 | 56 | 211 | 232 | Row 8 - Cell 7 | Row 8 - Cell 8 |
As expected, they used their trend-following skills and actually increased their short bets! This is not a practice I can recommend to you. In fact, hedgies swung by about 25% to the bearish side in one week a massive swell on the sentiment tide.
But that was excellent news for me because it indicated that a major low was highly likely to be nearby and a huge short squeeze would send the market flying higher.
And on Friday, the market flew up by about $50 off the day's low. My short squeeze was on.
Do bullish traders see a new tide in their affairs?
So here I am, bullish in the short term and bearish long term. I can live with that.
The EWT suggests that the immediate outlook is for an A-B-C rally. But there is another interpretation: my wave 5 could be a wave 3. Then, after a wave 4 rally, there could be a new move down below $1130 in wave 5 before a good rally can be mounted. But the sentiment and COT positions put this in the lower leagues.
So do bullishly inclined traders see a new tide in their affairs?
Get the latest financial news, insights and expert analysis from our award-winning MoneyWeek team, to help you understand what really matters when it comes to your finances.
John is is a British-born lapsed PhD physicist, who previously worked for Nasa on the Mars exploration team. He is a former commodity trading advisor with the US Commodities Futures Trading Commission, and worked in a boutique futures house in California in the 1980s.
He was a partner in one of the first futures newsletter advisory services, based in Washington DC, specialising in pork bellies and currencies. John is primarily a chart-reading trader, having cut his trading teeth in the days before PCs.
As well as his work in the financial world, he has launched, run and sold several 'real' businesses producing 'real' products.
-
 How a ‘great view’ from your home can boost its value by 35%
A house that comes with a picturesque backdrop could add tens of thousands of pounds to its asking price – but how does each region compare?
-
 What is a care fees annuity and how much does it cost?
How we will be cared for in our later years – and how much we are willing to pay for it – are conversations best had as early as possible. One option to cover the cost is a care fees annuity. We look at the pros and cons.