A Halloween scare for the gold market
The gold bulls are running scared. John C Burford examines the charts to find out what's spooked the gold market.
Get the latest financial news, insights and expert analysis from our award-winning MoneyWeek team, to help you understand what really matters when it comes to your finances.
You are now subscribed
Your newsletter sign-up was successful
Want to add more newsletters?

Twice daily
MoneyWeek
Get the latest financial news, insights and expert analysis from our award-winning MoneyWeek team, to help you understand what really matters when it comes to your finances.

Four times a week
Look After My Bills
Sign up to our free money-saving newsletter, filled with the latest news and expert advice to help you find the best tips and deals for managing your bills. Start saving today!
Today is Halloween and right on cue, markets are giving traders some major frights.
The gold bulls are running scared, while the smaller army of gold bears is enjoying the scene. But on the other hand, with the Japanese stimulus announced overnight, it is the stock bulls that are the happy bunch with the bears in rapid retreat.
The surprise massive extra stimulus announced by the Japanese central bank overnight was the catalyst that has propelled markets. The Dow is up by over 200 points and into new highs. I hope to cover the Dow next week, but today I want to look at the gold market.
MoneyWeek
Subscribe to MoneyWeek today and get your first six magazine issues absolutely FREE

Sign up to Money Morning
Don't miss the latest investment and personal finances news, market analysis, plus money-saving tips with our free twice-daily newsletter
Don't miss the latest investment and personal finances news, market analysis, plus money-saving tips with our free twice-daily newsletter
Fireworks in the gold chart
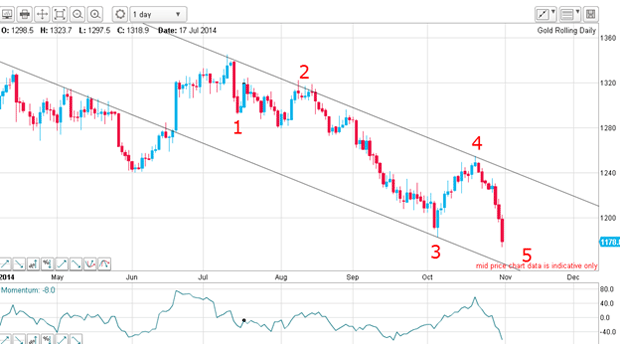
On Monday, I showed the most important gold chart you need. Here it is updated:

This remains the best gold chart you will ever need!
And as I write early this morning, the market has just broken through the critical $1,180 level. Fireworks indeed!
Note that my Elliott wave (EW) labels, which I put in many days ago, are guiding the market lower. As I showed on Monday, an excellent trade was to short at the $1,250 area. It has been downhill ever since.
There should be huge volatility today as $1,180 is tested again and again. Many bears will be taking some profits off the table, while there should be support from the ever-hopeful bulls who see cheap gold to stock up on.
A critical test for a continuation of the bear market would be today's closing price on Comex. If it closes solidly lower than the $1,180 support, then we can say that support has been breached and that should open the floodgates to much lower prices.
That would point to an extended fifth wave.
Remember, I have had a sub-$1,000 forecast in place for weeks. And is the declining gold market, which is reflecting a weakening demand for safe-haven assets, also forecasting deflation for the US? Very few expect that.
What's happening in the silver charts?
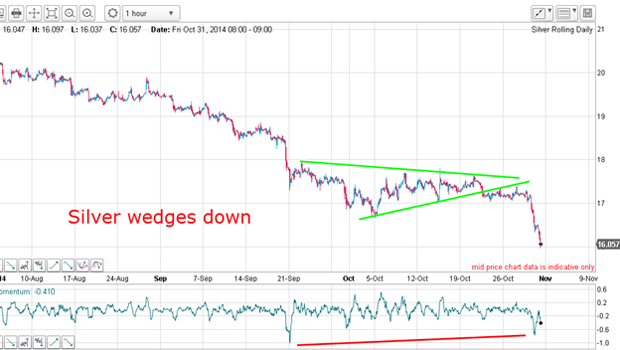
Silver, gold's sister metal, also broke major support overnight:

But with the possible positive-momentum divergence, we could be seeing support come in soon.
How to profit from destructive hedge fund policies
The dollar has been rampant and continues to be so with yesterday's Fed announcement and the overnight Japanese news and that is also hitting the gold price.
On Monday, I mentioned that sentiment, as measured by the DSI (daily sentiment index), rose from 7% bulls to over 30% bulls at the 21 October $1,250 high, and I suggested that was enough to relieve the lopsided bearish sentiment at the 5 October low.
Confirming my view was the latest COT (commitments of traders) data as of 21 October:
| (Contracts of 100 troy ounces) | Row 0 - Cell 1 | Row 0 - Cell 2 | Row 0 - Cell 3 | Open interest: 411,057 | ||||
| Commitments | ||||||||
| 207,129 | 99,145 | 30,768 | 139,429 | 244,327 | 377,326 | 374,240 | 33,731 | 36,817 |
| Changes from 10/14/14 (Change in open interest: 13,202) | ||||||||
| 13,549 | -9,020 | 733 | -1,208 | 24,867 | 13,074 | 16,580 | 128 | -3,378 |
| Percent of open in terest for each category of traders | ||||||||
| 50.4 | 24.1 | 7.5 | 33.9 | 59.4 | 91.8 | 91.0 | 8.2 | 9.0 |
| Number of traders in each category (Total traders: 315) | ||||||||
| 141 | 99 | 75 | 51 | 54 | 221 | 203 | Row 8 - Cell 7 | Row 8 - Cell 8 |
Hedge funds (the non-commercials) true to their destructive policy as trend-followers had ramped up their net long bets by increasing their longs and decreasing their shorts. They saw the budding rally in early October as reason enough to get long as stocks fell hard mid-month. That trade made sense; but in the markets, making (conventional) sense rarely pays off. They ended up net two-to-onelong, which is on the low side, on average.
The market topped out that very day and the hedge funds were left stranded high and dry in a classic bull trap. That is when I went against the hedgies and positioned short.
I just love it when I can take money off them and currently the market is trading $80 lower in just over a week. Nice.
How to verify your Elliot waves
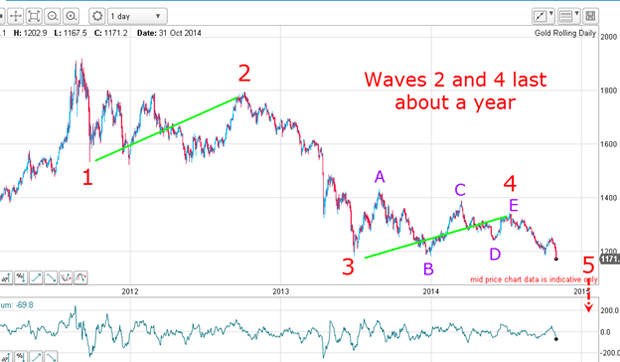
Let's look at the bigger picture, because it verifies my larger EW picture that I have been working with:

With the $1,180 level now breached, that confirms we are also in a large wave 5 down and I can have confidence in my wave 4 top label.
One other clue is provided by the scale of the waves. Let me explain.
Waves 2 and 4 lasted just over a year equally (check the green lines). This is important because it illustrates the principle that the Elliott waves must look right' in time duration as well as in price height. Waves 2 and 4 certainly fit this description.
For instance, in the summer of 2013, as the market made its first counter-trend rally off the $1,180 support level in the A wave, it could be said that this wave was wave 4. Although its height was about right, it was way too short in time to qualify as a fourth wave. That is why I rejected that interpretation at the time and began to think of it as the first wave of a complex five-wave pattern for the wave 4. Remember, fourth waves are usually complex.
And subsequent price action justified my belief and that is why I was able to successfully navigate the five waves, while some other traders not having the correct EW interpretation were foundering without a compass, and likely being whipsawed.
Fifth waves usually have a Fibonacci relationship with first waves. As my first major target, at simple wave equality, that would place the end of wave 5 in the $950 area.
My best guess is that wave 5 will extend beyond that level, but time will tell.
So at present, I am happy with my short trade and will look at tonight's closing price very carefully.
Get the latest financial news, insights and expert analysis from our award-winning MoneyWeek team, to help you understand what really matters when it comes to your finances.
John is is a British-born lapsed PhD physicist, who previously worked for Nasa on the Mars exploration team. He is a former commodity trading advisor with the US Commodities Futures Trading Commission, and worked in a boutique futures house in California in the 1980s.
He was a partner in one of the first futures newsletter advisory services, based in Washington DC, specialising in pork bellies and currencies. John is primarily a chart-reading trader, having cut his trading teeth in the days before PCs.
As well as his work in the financial world, he has launched, run and sold several 'real' businesses producing 'real' products.
-
 MoneyWeek Talks: The funds to choose in 2026
Podcast Fidelity's Tom Stevenson reveals his top three funds for 2026 for your ISA or self-invested personal pension
-
 Three companies with deep economic moats to buy now
Opinion An economic moat can underpin a company's future returns. Here, Imran Sattar, portfolio manager at Edinburgh Investment Trust, selects three stocks to buy now