Gold – this is the most important chart today
John C Burford examines the gold charts, and explains why managing your risks is crucial to trading successfully.
Get the latest financial news, insights and expert analysis from our award-winning MoneyWeek team, to help you understand what really matters when it comes to your finances.
You are now subscribed
Your newsletter sign-up was successful
Want to add more newsletters?

Twice daily
MoneyWeek
Get the latest financial news, insights and expert analysis from our award-winning MoneyWeek team, to help you understand what really matters when it comes to your finances.

Four times a week
Look After My Bills
Sign up to our free money-saving newsletter, filled with the latest news and expert advice to help you find the best tips and deals for managing your bills. Start saving today!
Gold is unlike any other commodity. Just about all of the gold ever mined remains above ground in one form or another virtually none gets consumed. Therefore, the normal economic laws of supply and demand do not operate in the gold market. That is an important concept to grasp if you trade gold.
Consider a normal' commodity such as wheat. It is grown as a crop and then transformed into everyday products such as bread, pasta, and even (in the old days) library paste. Some is fed to farm animals. Excess supply over demand is stored for the future.
Wheat's price is very much governed by supply, demand, stocks on hand and the all-important forecasts of the next year's likely supply and demand. Weather also often plays a crucial role. If stocks build up, prices will generally be under pressure, and vice versa.
MoneyWeek
Subscribe to MoneyWeek today and get your first six magazine issues absolutely FREE

Sign up to Money Morning
Don't miss the latest investment and personal finances news, market analysis, plus money-saving tips with our free twice-daily newsletter
Don't miss the latest investment and personal finances news, market analysis, plus money-saving tips with our free twice-daily newsletter
But all of the gold above ground is theoretically available as a source of supply to the market and that is building all the time, year after year; it never decreases.
That is why I am constantly puzzled by an intense focus by many market operators on the supply and demand figures, as if they can give a clue to market direction. Usually, they are trotted out by both bulls and bears (but usually the bulls) when they wish to justify their market opinion.
A case in point: much is being made by the bulls of this November's Swiss referendum mandating the Swiss central bank to increase its gold reserves. They believe this will be supportive of the market as they try to justify their bullish stance.
It may or it may not, since extra buying by the Swiss may be met by transfers from other central banks with no effect on price. In fact, I have found that central bank operations have little or no impact on the open market. And changes in central bank holdings is another red herring in gold market forecasting except that when certain banks sell, that is usually a contrary signal.
What really drives the gold price?
If supply and demand factors have little or no impact on the market in the near term, then what does drive gold?
Long-time readers of my Trader postswill know the answer already: it is market sentiment, pure and simple, that drives gold.
Most of us remember the period from before 2000 to the all-time high in 2011 when the overwhelming sentiment was bullish. This was based on the received wisdom that the dollar was doomed with US federal debt climbing exponentially, and hyper-inflation round the corner. Most believe gold is a reliable inflation hedge (it is not), and so buying gold was the logical trade.
But that story turned out to be completely false (what a surprise!) and the market has been in a downtrend since October 2011.
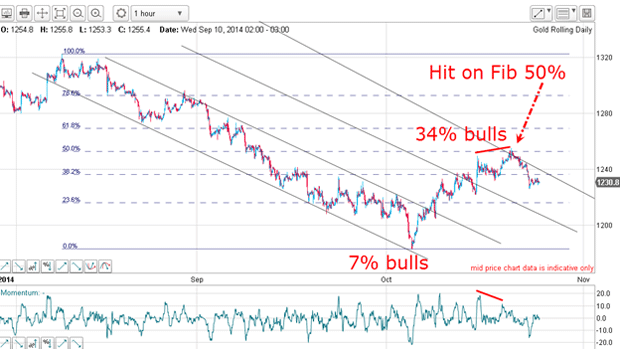
When I last covered gold on 17 October, I noted that at the 3 October $1,180 low, sentiment was extremely bearish. In fact, the DSI (daily sentiment index) reading was only 7% bulls. Gold was hated compared with the much-loved equities.
With the rally off that low, more and more bulls joined in and at the 21 October high, DSI had risen to well over 30%, thus relieving the sentiment extreme.
This is what typically happens when a market reverses course at the lows, bullish sentiment is often extremely low. Then, when a little buying lifts the market, sidelined bulls start to believe again and resume their buying. Then, some of the shorts see their profits dwindle and cover their positions, thus boosting the market even further.
Here's the most important gold chart
Now let's look at the updated hourly gold chart:

I have adjusted my tramlines slightly to make a better fit and the rally to the fourth tramline hit the Fibonacci 50% retrace and on a negative-momentum divergence. This looks like a solid area of resistance and a possible turning point.
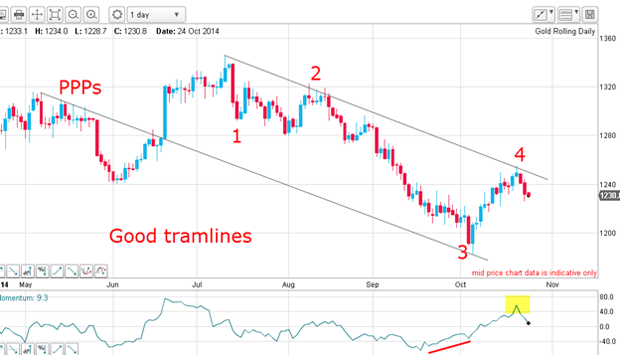
But to shed more light, here is the daily chart which is the most important gold chart I can show you:

My lower tramline has only one accurate touch point, but just admire all those PPPs (prior pivot points) back in May. That points to an accurate tramline and my upper line now has the 21 October high as an accurate touch point. And that high was made with momentum at overbought levels (highlighted).
That all added to my case that the rally was very likely over at the $1,250 area. That was the place to exit all long trades and enter short trades, which could be placed with low risk.
Since then, the market has declined by over $20. And now, if you were to use my break-even rule, a protective stop could be moved to that $1,250 from the current position entry price to give a very nice loss-free trade.
Why money management is vital for trading success
There are two parts to trading: the strategy and the tactics. The strategy is the analysis of the trends and the tactics are the timing of the trades and the management of them as they progress. Get one part wrong, and it's a losing trade.
That is why I constantly emphasise the critical role that a disciplined approach to money management is vital for success.
OK, with the market having turned back down, it is in alignment with the major trend and that is always the best position to be in. My previous trade long gold was counter-trend. Despite that being a winner, I was always nervously looking for the exit.
But above all, let the market tell you what it wants to do and observe it with no bias. Then, go with the path of least resistance but keep stops tight, just in case.
Get the latest financial news, insights and expert analysis from our award-winning MoneyWeek team, to help you understand what really matters when it comes to your finances.
John is is a British-born lapsed PhD physicist, who previously worked for Nasa on the Mars exploration team. He is a former commodity trading advisor with the US Commodities Futures Trading Commission, and worked in a boutique futures house in California in the 1980s.
He was a partner in one of the first futures newsletter advisory services, based in Washington DC, specialising in pork bellies and currencies. John is primarily a chart-reading trader, having cut his trading teeth in the days before PCs.
As well as his work in the financial world, he has launched, run and sold several 'real' businesses producing 'real' products.
-
 UK interest rates live: rates held at 3.75%
The Bank of England’s Monetary Policy Committee (MPC) met today to decide UK interest rates, and voted to hold rates at their current level
-
 MoneyWeek Talks: The funds to choose in 2026
Podcast Fidelity's Tom Stevenson reveals his top three funds for 2026 for your ISA or self-invested personal pension