Is the euro forming a bottom here?
The euro has been steadily falling against the dollar. John C Burford examines the charts to see whether a rally is on the cards.
Get the latest financial news, insights and expert analysis from our award-winning MoneyWeek team, to help you understand what really matters when it comes to your finances.
You are now subscribed
Your newsletter sign-up was successful
Want to add more newsletters?

Twice daily
MoneyWeek
Get the latest financial news, insights and expert analysis from our award-winning MoneyWeek team, to help you understand what really matters when it comes to your finances.

Four times a week
Look After My Bills
Sign up to our free money-saving newsletter, filled with the latest news and expert advice to help you find the best tips and deals for managing your bills. Start saving today!
Today, I will pick up covering the euro from last Monday simply because it shines a light on the difficulties in attaching the correct Elliott wave (EW) labels to the waves as they are being formed.
Of course in hindsight all is clear. But then the opportunity is gone. So we must deal with the information we have in the present and that information is always incomplete.
Market forecasting using EWs, or any other method for that matter, is an exercise in probability. To my knowledge, nobody has yet managed to secure a crystal ball, despite what some pundits claim. Although the future is unknowable with certainty, some events are more probable than others.
MoneyWeek
Subscribe to MoneyWeek today and get your first six magazine issues absolutely FREE

Sign up to Money Morning
Don't miss the latest investment and personal finances news, market analysis, plus money-saving tips with our free twice-daily newsletter
Don't miss the latest investment and personal finances news, market analysis, plus money-saving tips with our free twice-daily newsletter
That is what we are working with as traders. In general, trends continue on their established paths. In a downtrend, for example, the best low-risk trade entries are short positions on rallies.
The highest risk entries are generally short positions on dips. That is because you are more at risk of being stopped out on a normal relief rally which could extend farther than you hoped.
Did my best guess scenario work out?
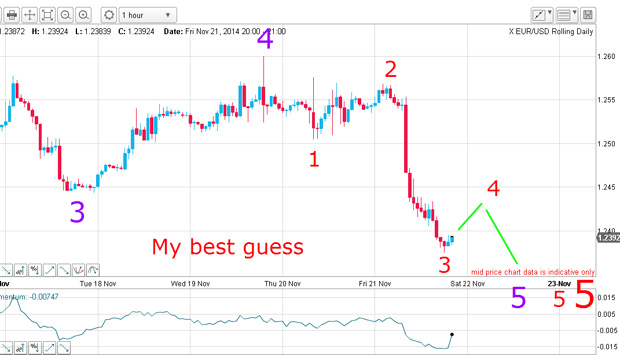
I have a long and strong wave down and working backwards, I could identify waves 1 and 2 very easily. It appears to be a textbook third wave (I can also count five sub-waves within it). Therefore, my best guess was for a wave 4 rally and then a decline in wave 5 to a new low.
The best laid plans of mice and men! But instead of a small relief rally in w4, this is what occurred:
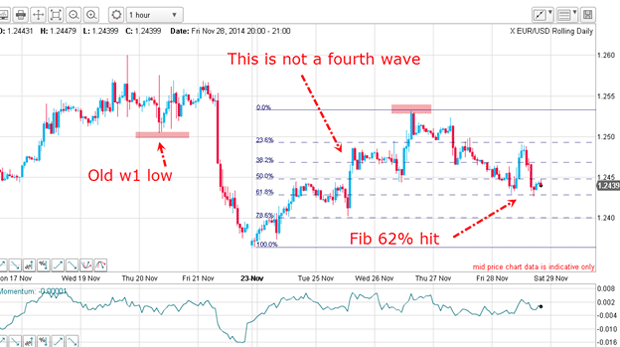
Last Monday, the market did begin a relief rally and it certainly looked as if my best guess scenario was going to work out. There is a small scale A-B-C to Monday's high, which gave me even more encouragement.
But on Tuesday, the market caught a bid and moved sharply higher. This had all the hallmarks of the short squeeze I forecast. Remember, bullish sentiment was in the cellar and this is when short squeezes become very probable.
And when the market extended its rally on Wednesday and moved above the old w1 low (pink bars), I had to throw my old labels out of the window. That is because one of the EW rules holds that in a five motive-wave pattern, w4 must not overlap the price territory of w1.
But the unexpected strength caused me to think that the market had turned and was poised for a major move up. Recall, I was expecting a bottom in EUR/USD at some stage and eventually wished to seek a long trade. I believed that the market was lopsidedly bearish and the bears were due a surprise.
Later in the week, the market moved back down off the long-term tramline (see later), but then hit support at the Fibonacci 62% level. This will be a good test for my uptrend theory. If the market drops well below this level, chances are the 78% level will be tested.
What the daily chart tells us
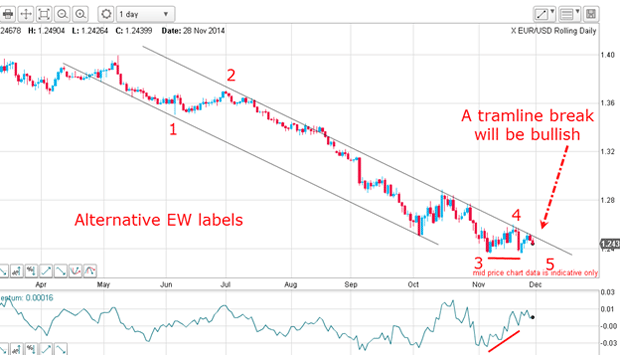
I have reset waves 3, 4 and 5 now as an alternative equally valid as the old labels. And this throws up a major headache for EW analysis deciding when a third wave has ended. I have two scenarios of equal merit, so what to do?
This is where my tramlines and Fibonacci come in.
If the market can rally above the upper tramline with force, that would make the reversal scenario much more probable and my previous EW labels correct. If not, then the market will move lower off last week's bounce and head towards the lower tramline in my alternate scenario.
Why we could see a decent rally
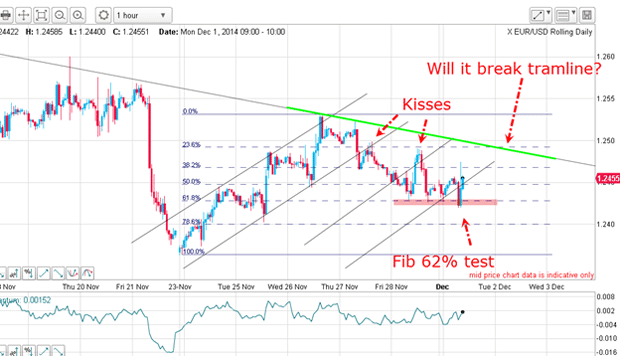
If this level holds, odds are that the main tramline in the 1.25 area will be challenged. I have four pretty good up-sloping tramlines and the lowest one has this morning suffered a spike break down to the Fibonacci 62% level.
It has bounced off this level very smartly, so the market evidently respects this as a solid line of support.
The odds are now stacking up in favour of a decent rally.
Get the latest financial news, insights and expert analysis from our award-winning MoneyWeek team, to help you understand what really matters when it comes to your finances.
John is is a British-born lapsed PhD physicist, who previously worked for Nasa on the Mars exploration team. He is a former commodity trading advisor with the US Commodities Futures Trading Commission, and worked in a boutique futures house in California in the 1980s.
He was a partner in one of the first futures newsletter advisory services, based in Washington DC, specialising in pork bellies and currencies. John is primarily a chart-reading trader, having cut his trading teeth in the days before PCs.
As well as his work in the financial world, he has launched, run and sold several 'real' businesses producing 'real' products.
-
 Pension Credit: should the mixed-age couples rule be scrapped?
The mixed-age couples rule was introduced in May 2019 to reserve pension credit for older households but a charity warns it is unfair
-
 Average income tax by area: The parts of the UK paying the most tax mapped
The UK’s total income tax bill was £240.7 billion 2022/23, but the tax burden is not spread equally around the country. We look at the towns and boroughs that have the highest average income tax bill.