Is the euro doomed?
John C Burford returns to his euro trade, and warns that the fireworks could start at any time.
Get the latest financial news, insights and expert analysis from our award-winning MoneyWeek team, to help you understand what really matters when it comes to your finances.
You are now subscribed
Your newsletter sign-up was successful
Want to add more newsletters?

Twice daily
MoneyWeek
Get the latest financial news, insights and expert analysis from our award-winning MoneyWeek team, to help you understand what really matters when it comes to your finances.

Four times a week
Look After My Bills
Sign up to our free money-saving newsletter, filled with the latest news and expert advice to help you find the best tips and deals for managing your bills. Start saving today!
The last time I covered the euro was on 29 September, and I thought it high time I returned to this market. Back then, I asked the question: "Can the dollar continue its climb?"
In late September, the Daily Sentiment Index (DSI) had fallen to an incredibly low 3% bulls with the EUR/USD trading around the 1.25 area, following a huge bear trend from the 1.40 top made in May.
When sentiment gets this extreme, I know the trend is about to change it is just a question of when, not if.
MoneyWeek
Subscribe to MoneyWeek today and get your first six magazine issues absolutely FREE

Sign up to Money Morning
Don't miss the latest investment and personal finances news, market analysis, plus money-saving tips with our free twice-daily newsletter
Don't miss the latest investment and personal finances news, market analysis, plus money-saving tips with our free twice-daily newsletter
The counter-trend could take the shape of a minor relief rally or a major reversal. In reality, there is no certain means of knowing in advance which option is the more likely to play out, although the larger Elliott wavepattern often helps.
And this rally will occur despite what the fundamentals' say. I believe that by making the study of the economic fundamentals central to your analysis, you will be placing the most reliance on them just when the trend changes and your confidence is highest. As Gustave Flaubert once said: "There is no truth, only perception". Trading is a very zen activity.
So today, I want to show what happens when best laid plans go (slightly) awry.
Even the best laid plans can go awry
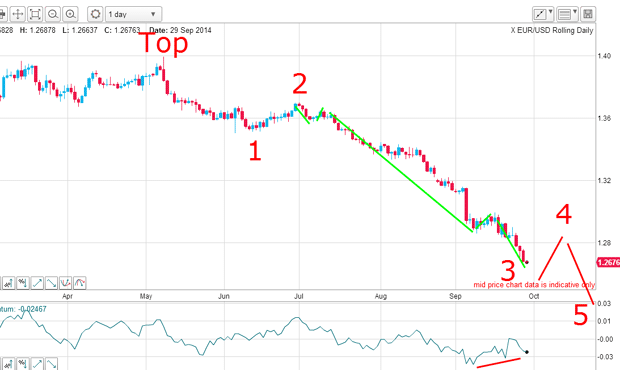
This was the daily chart at the end of September:

It shows the move down off the 1.40 high in three Elliott waves with the third wave very long and strong and a looming positive momentum divergence.I was expecting a wave 4 rally to start from near the current levels. How high could I expect it to reach? That is a tough question.
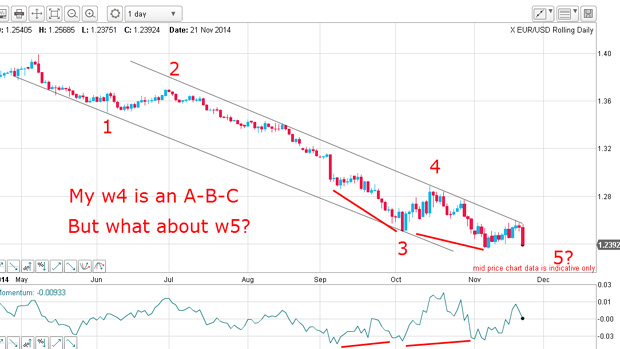
Here is the updated daily chart:

The market did make its w3 low two days later and rallied in a clear A-B-C in w4. And when that high was in, I could draw in a reliable tramline pair and it is pure textbook.
First, the lower line has both the w1 and w3 lows as accurate touch points. And second, I have four accurate touch points on my upper tramline.
Following this w4 high (and note the very high overbought momentum reading at the high), I felt confident we were in w5 down from mid-October. But this was no place to enter a short trade!
How low did wave 5 go?
The only question I had was this: how low would wave 5 go? If I could pinpoint that, I could enter a low-risk long trade my ultimate desire. And because bullish euro sentiment was still on the floor, I could expect a significant move up and garner hundreds of pips in the process.
Remember, this proposed long trade would be massively opposed to received wisdom. Isn't the eurozone in deep trouble with GDP growth weak and the ECB mulling a vast new QE campaign in the manner of that instigated by most of the other major central banks? Surely, a long trade would be suicide!
To which I say: these are the ideal conditions for a massive rally. And if I am wrong at least on the first attempt I have my money management rules to keep major losses at bay. And if I am correct, a juicy profit beckons.
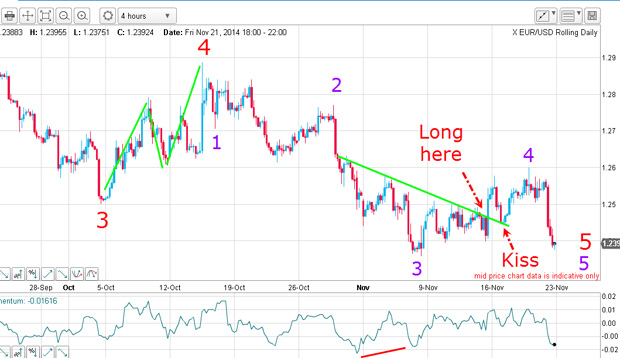
So let's have a look at this wave 5 on the 4-hourly:

Into November, I knew I was close to a major turn. And when the market made new lows below 1.25, I noted the short-term trendline (marked in green) and decided to place a stop order just above this line. My order was touched as the market moved above it with force on 14 November.
It then moved down to plant a traditional kiss on the green line and moved sharply higher. That action gave me lots of encouragement that I had indeed found the turn (I had not labelled the Elliott waves then).
How to avoid a losing trade
But overnight on Friday, China decided to lower interest rates and that spoilt my party. Heavy dollar-buying forced the euro down on Friday. But I suffered no loss on that trade I had moved my protective stop to break even earlier.
Trade summary
14 Nov Long EUR/USD @ 1.2490. Protective stop (PS) @ 1.2430
18 Nov Moved PS to break even at 1.2490
21 Nov Exit trade at break even. No loss.
And that is the moral of my story the use of my break even rulehas kept me out of losing trades on many occasions. In fact, this simple money management rule is the best weapon I have to fight losses.
So now if my new EW labels are correct, I can expect a new low below the w3 low. That may arrive this week.
When the low is in, that would be the end of two fifth waves of different degrees a most powerful setup.
Watch out for the fireworks!
To check on sentiment changes, here is the latest COT (commitments of traders) table:
Untitled Document
| CONTRACTS OF EUR 125,000 | Row 0 - Cell 1 | Row 0 - Cell 2 | Row 0 - Cell 3 | Open interest: 465,168 | ||||
| Commitments | ||||||||
| 58,048 | 226,778 | 9,306 | 365,846 | 141,782 | 433,200 | 377,866 | 31,968 | 87,302 |
| Changes from 11/11/14 (Change in open interest: 11,192) | ||||||||
| -2,406 | 2,431 | 2,378 | 339 | -777 | 311 | 4,032 | 881 | -2,840 |
| Percent of open interest for each category of traders | ||||||||
| 12.5 | 48.8 | 2.0 | 78.6 | 30.5 | 93.1 | 81.2 | 6.9 | 18.8 |
| Number of traders in each category (Total traders: 191) | ||||||||
| 46 | 86 | 64 | 49 | 61 | 111 | 165 | Row 8 - Cell 7 | Row 8 - Cell 8 |
Hedge funds and small specs remain massively short the euro, so the fireworks can start at any time.
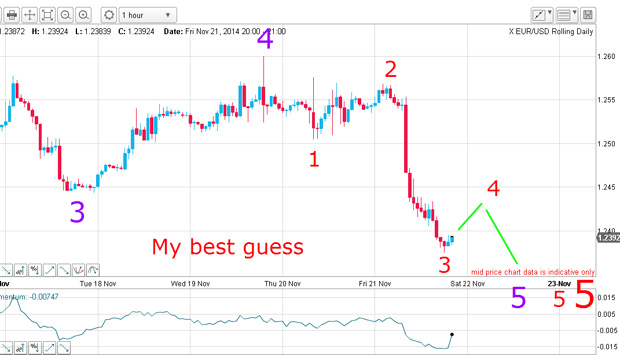
Finally, I can zero in even tighter on the hourly:

This is the fifth (purple) wave and I can count these three waves (red) within. I have a long and strong w3 and all I require now is a w4 rally and then a new low in w5. And that would make three fifth waves of different degrees a truly powerful setup.
Watch out for the fireworks!
Get the latest financial news, insights and expert analysis from our award-winning MoneyWeek team, to help you understand what really matters when it comes to your finances.
John is is a British-born lapsed PhD physicist, who previously worked for Nasa on the Mars exploration team. He is a former commodity trading advisor with the US Commodities Futures Trading Commission, and worked in a boutique futures house in California in the 1980s.
He was a partner in one of the first futures newsletter advisory services, based in Washington DC, specialising in pork bellies and currencies. John is primarily a chart-reading trader, having cut his trading teeth in the days before PCs.
As well as his work in the financial world, he has launched, run and sold several 'real' businesses producing 'real' products.
-
 MoneyWeek Talks: The funds to choose in 2026
Podcast Fidelity's Tom Stevenson reveals his top three funds for 2026 for your ISA or self-invested personal pension
-
 Three companies with deep economic moats to buy now
Opinion An economic moat can underpin a company's future returns. Here, Imran Sattar, portfolio manager at Edinburgh Investment Trust, selects three stocks to buy now