Is the euro doomed?
The eurozone debt bail-out drama is intensifying. So does that mean the euro is doomed to fall? John C Burford investigates.
Get the latest financial news, insights and expert analysis from our award-winning MoneyWeek team, to help you understand what really matters when it comes to your finances.
You are now subscribed
Your newsletter sign-up was successful
Want to add more newsletters?

Twice daily
MoneyWeek
Get the latest financial news, insights and expert analysis from our award-winning MoneyWeek team, to help you understand what really matters when it comes to your finances.

Four times a week
Look After My Bills
Sign up to our free money-saving newsletter, filled with the latest news and expert advice to help you find the best tips and deals for managing your bills. Start saving today!
I last covered the euro against the US dollarway back on 21 October. Quite a lot has occurred since then.
Then, I was trying to decide whether the euro could rally in the face of overwhelming bearish sentiment. The bear/bull ratio was three-to-one, according to the Commitments of Traders reports.
The euro was trading at around the 1.37 area at the time I wrote, and here is what I said:
MoneyWeek
Subscribe to MoneyWeek today and get your first six magazine issues absolutely FREE

Sign up to Money Morning
Don't miss the latest investment and personal finances news, market analysis, plus money-saving tips with our free twice-daily newsletter
Don't miss the latest investment and personal finances news, market analysis, plus money-saving tips with our free twice-daily newsletter
"I would say that if the market can rally past my upper tramline, that should propel it much higher towards the huge 1.39 resistance I have mentioned, perhaps and right through it."
As it turned out, the market did rally past the 1.39 resistance, and topped out at over 1.42 on 27 October.
That 500-pip rally shook a lot of bears out of the tree.
Since then, we have had the euro bail-out drama intensify, which has knocked the euro back down to the recent low of 1.3650 last Tuesday.
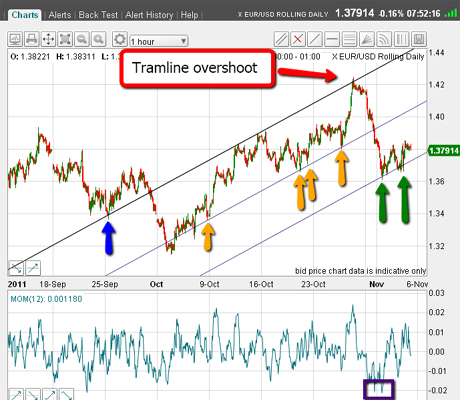
Here is the hourly chart:

(Click on the chart for a larger version)
I have drawn in what I consider is a terrific tramline trio. I have used the previous significant low (blue arrow) as my anchor point for the upper tramline, which takes in the subsequent highs, complete with a small overshoot.
If you would like to know why this point marked by my blue arrow is significant, see my video tutorials on tramline trading .
I had a little difficulty deciding where to place the centre tramline, but I used the most recent lows marked by the yellow arrows as guides.
Then, I could draw in my lower tramline equidistant even before the markets had dropped to it.
The market then dropped right down to the lower tramline, and is currently bouncing off it (green arrows). Isn't that pretty?
I was holding a short position and covered near that tramline for a very nice gain. Momentum was oversold (purple box) and was another good reason to cover.
I have just released my latest video tutorial on momentum .
A gift for short sellers
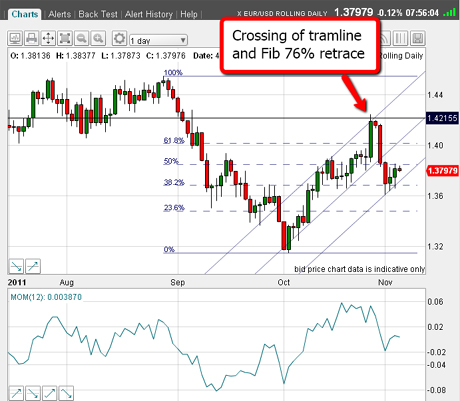
In terms of the bigger picture, here is the daily chart showing the recent plunge off the September high and the rally off the early October low.

(Click on the chart for a larger version)
This rally took it to the crossing of the Fibonacci 76% retrace (the heavy horizontal line) and the upper tramline.
That was a natural place for the rally to terminate, especially with momentum reaching well into overbought territory.
This was a gift for the short-sellers. Risk was low, as a rally extension was most improbable (though of course, not impossible).
Also, the market at the 1.42 area was eating into overhead resistance, shown by the August-September congestion zone to the left of the chart.
I have discussed what happens when the market enters a congestion zone before. This is an area of trading where longs and shorts build their positions. If the market moves away from the zone and against one group, many will be anxious to cover their trades with the smallest possible loss. If the market comes back to near their entry price, they cover and give thanks.
In this case, it means that many of the euro longs from August-September saw their losses build as the market fell, but were glad to liquidate as the market rallied to where they had entered, thereby suffering little or no loss on the trade.
But it is not a method I would recommend for you! It is strictly for the professionals.
Are there any trades to go for now?
So, where are we this morning? I am flat and looking for my next trade. Can I spot anything?
Gazing at the initial chart (which I've posted again below), if the market can break below the lower tramline, that would indicate the market may well have a go at challenging the recent 1.32 low.

(Click on the chart for a larger version)
However, there is a possibility that the market may rally to challenge the underside of my central tramline near the 1.41 area.
Frankly, I really do not see anything to go for just yet, so I will let the patterns develop and keep my powder dry.
If you're a new reader, or need a reminder about some of the methods I refer to in my trades, then do have a look at my introductory videos:
The essentials of tramline trading
An introduction to Elliott wave theory
Don't miss my next trading insight. To receive all my spread betting blog posts by email, as soon as I've written them, just sign up here .
Get the latest financial news, insights and expert analysis from our award-winning MoneyWeek team, to help you understand what really matters when it comes to your finances.
John is is a British-born lapsed PhD physicist, who previously worked for Nasa on the Mars exploration team. He is a former commodity trading advisor with the US Commodities Futures Trading Commission, and worked in a boutique futures house in California in the 1980s.
He was a partner in one of the first futures newsletter advisory services, based in Washington DC, specialising in pork bellies and currencies. John is primarily a chart-reading trader, having cut his trading teeth in the days before PCs.
As well as his work in the financial world, he has launched, run and sold several 'real' businesses producing 'real' products.
-
 Pitch to Portfolio: Lioness Jill Scott's investing game plan
Podcast After bringing football home as a Lioness, Jill Scott discusses how she transformed her finances and became an investor in this latest episode of MoneyWeek Talks.
-
 UK unemployment hits highest level since 2021 – will interest rate cuts follow?
UK unemployment reached its highest rate in almost five years by the end of 2025. Is AI to blame and will the Bank of England step in with an interest rate cut in March?