Is gold still in a bear market?
Gold has been making some surprising moves lately, says John C Burford. So is the bear market under way again, or are we going to see new highs?
Get the latest financial news, insights and expert analysis from our award-winning MoneyWeek team, to help you understand what really matters when it comes to your finances.
You are now subscribed
Your newsletter sign-up was successful
Want to add more newsletters?

Twice daily
MoneyWeek
Get the latest financial news, insights and expert analysis from our award-winning MoneyWeek team, to help you understand what really matters when it comes to your finances.

Four times a week
Look After My Bills
Sign up to our free money-saving newsletter, filled with the latest news and expert advice to help you find the best tips and deals for managing your bills. Start saving today!
Today, I can finally get back to one of my favourite (though often frustrating) markets: gold.
As you can see from my previous articles, I am a bear on gold. It satisfies my basic contrarian personality at a time when the public is overwhelmingly bullish on the metal.
Since my last article on gold on 10 February, the market rallied initially then suffered a $100 plunge on 29 February. It is struggling to get up off the floor as I write.
MoneyWeek
Subscribe to MoneyWeek today and get your first six magazine issues absolutely FREE

Sign up to Money Morning
Don't miss the latest investment and personal finances news, market analysis, plus money-saving tips with our free twice-daily newsletter
Don't miss the latest investment and personal finances news, market analysis, plus money-saving tips with our free twice-daily newsletter
In that article, I had a first downside target at $1,710. The market duly made a low just below that level in mid-February.
But then it found support. It never made it to my second wave target of $1,660. Instead, it rallied to the $1,790 level, which was the high prior to the big drop.
This cancelled out my initial Elliott wave third wave down hypothesis, but it did confirm my A-B-C alternative.
Trader tip: This refusal to follow the Elliott wave script for third waves of a potential five-wave sequence is one of the greatest benefits of this theory.
At an early stage, I could see that there was not going to be a long and strong' third wave. I could then abandon any short positions and label the down move as a counter-trend A-B-C pattern, from which new highs can be expected.
However, the market has since dropped to a low at the $1,660 level my second initial target. As I never tire of saying, markets exist to surprise the majority in this case, me!
So can I say that the bear market is under way again, or shall we see new highs above $1,920 the current all-time high? Let's get right to the charts.
Where to now for gold?

(Click on the chart for a larger version)
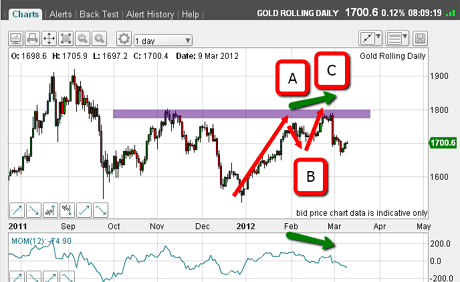
This is the daily chart showing the action off the $1,920 double top made in late summer last year.
Right away, I can see that the $1,800 level offers very powerful resistance. I have marked this area with the purple bar. Obviously, it would take a massive effort now to overcome this.
Also, I can see the recent rally to $1,790 sports a very clear A-B-C form complete with negative momentum divergence as marked by my green arrows.
This indicates that the buying conviction to put in the C wave, was weaker than that to make the A wave. These divergences are often preludes to reversals as occurred here.
The bear case for gold is strong but not in the short term
So far, I have a strong case for the bear cause. So will it be plain sailing from here down towards my major target at sub-$1,550 (the December lows)?
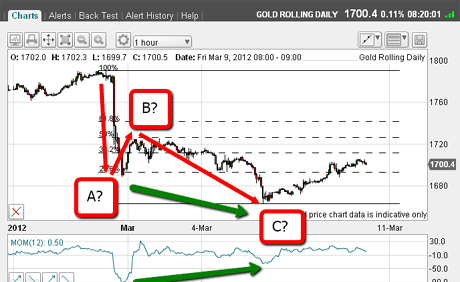
To add a little spice to the mix, here is the hourly chart showing the move off the $1,790 high:

(Click on the chart for a larger version)
I can label these waves down as a potential A-B-C pattern complete with a potential positive momentum divergence. (The plunge from $1,790 forms wave A, the rebound from there up over $1,720 would be B, and the drop to $1,660 is C).
If correct, I can expect a further move up from here. That would be a fly in the ointment for the bears!
But note that we have not yet reached the Fibonacci 38% or 50% retracements, which would be entirely normal corrections in a bear move.
So it appears the picture is mixed bearish on the larger scale, but potentially bullish short-term. In fact, a typical situation for traders!
Also, the current market rally is eating into overhead resistance between waves A and C. This may be enough to turn the market back down to cancel out the potentially bullish implications.
So how do I trade this situation?
I have a short trade taken out during the 29 February plunge, and will adjust my protective stop to a level just above the wave A high (in the chart above), which is the Fibonacci 50% retrace, of course.
If I didn't already have a position, and if the market rallies to one of the above Fibonacci levels, I may be tempted to put out a short trade using a close stop, especially if the Fibonacci level is touched in a spike.
To cancel out the potentially bullish A-B-C labels, I would like to see a move down below the C wave.
This morning, the odds do favour a resumption of the bear market, but with the possibility of a minor rally.
Failure of the current $1,706 area would be very bearish, as this is the exact Fibonacci 1/3 retrace of the move down off the $1,790 high!I would classify this as a shallow bounce off the $1,660 low, which would herald a probable quick move down to challenge the $1,660 low.
Trader tip: On my trading platform, the significant 1/3 level is missing, so I have to put it in by hand (and compute using my trusty calculator!). I recommend you do the same whenever the market is trading around the 1/3 and 2/3 levels.
If you're a new reader, or need a reminder about some of the methods I refer to in my trades, then do have a look at my introductory videos:
The essentials of tramline trading
An introduction to Elliott wave theory
Advanced trading with Elliott waves
Don't miss my next trading insight. To receive all my spread betting blog posts by email, as soon as I've written them, just sign up here .
Get the latest financial news, insights and expert analysis from our award-winning MoneyWeek team, to help you understand what really matters when it comes to your finances.
John is is a British-born lapsed PhD physicist, who previously worked for Nasa on the Mars exploration team. He is a former commodity trading advisor with the US Commodities Futures Trading Commission, and worked in a boutique futures house in California in the 1980s.
He was a partner in one of the first futures newsletter advisory services, based in Washington DC, specialising in pork bellies and currencies. John is primarily a chart-reading trader, having cut his trading teeth in the days before PCs.
As well as his work in the financial world, he has launched, run and sold several 'real' businesses producing 'real' products.
-
 How a ‘great view’ from your home can boost its value by 35%
A house that comes with a picturesque backdrop could add tens of thousands of pounds to its asking price – but how does each region compare?
-
 What is a care fees annuity and how much does it cost?
How we will be cared for in our later years – and how much we are willing to pay for it – are conversations best had as early as possible. One option to cover the cost is a care fees annuity. We look at the pros and cons.